How Private Credit Works
A highest calling of mankind is private credit

We want to provide a high-level overview of private credit (PC), for broad understanding of the subject, not a granular analysis picking apart every nuance. We will present relevant figures, concepts and active assets involved. The information provided is a combination of regulators’, market participants’ and independent risk assessors’ points of view on the subject, supported by illustrative data from trusted sources, that is, however, not intended to be definitive.
What is Private Credit?
Private credit is a small part of the private debt market within broader Nonbank Financial Institutions (NBFIs) sector. Predominantly serving underserved middle market and SME companies’ financing demand but increasingly interconnected with banking sector and other traditional lenders, proliferating into other niches with ever-greater complexity in debt structures. PC is having a broad investor base, from me and you, individual-retail investors that is, to pension funds and sovereign wealth funds, due to demand for high returns and yield premiums it can offer. PC experienced a rapid growth post-Great Financial Crisis (GFC) across all private markets categories. However, to answer what it is exactly, we need to unpack its various components. Let’s begin:
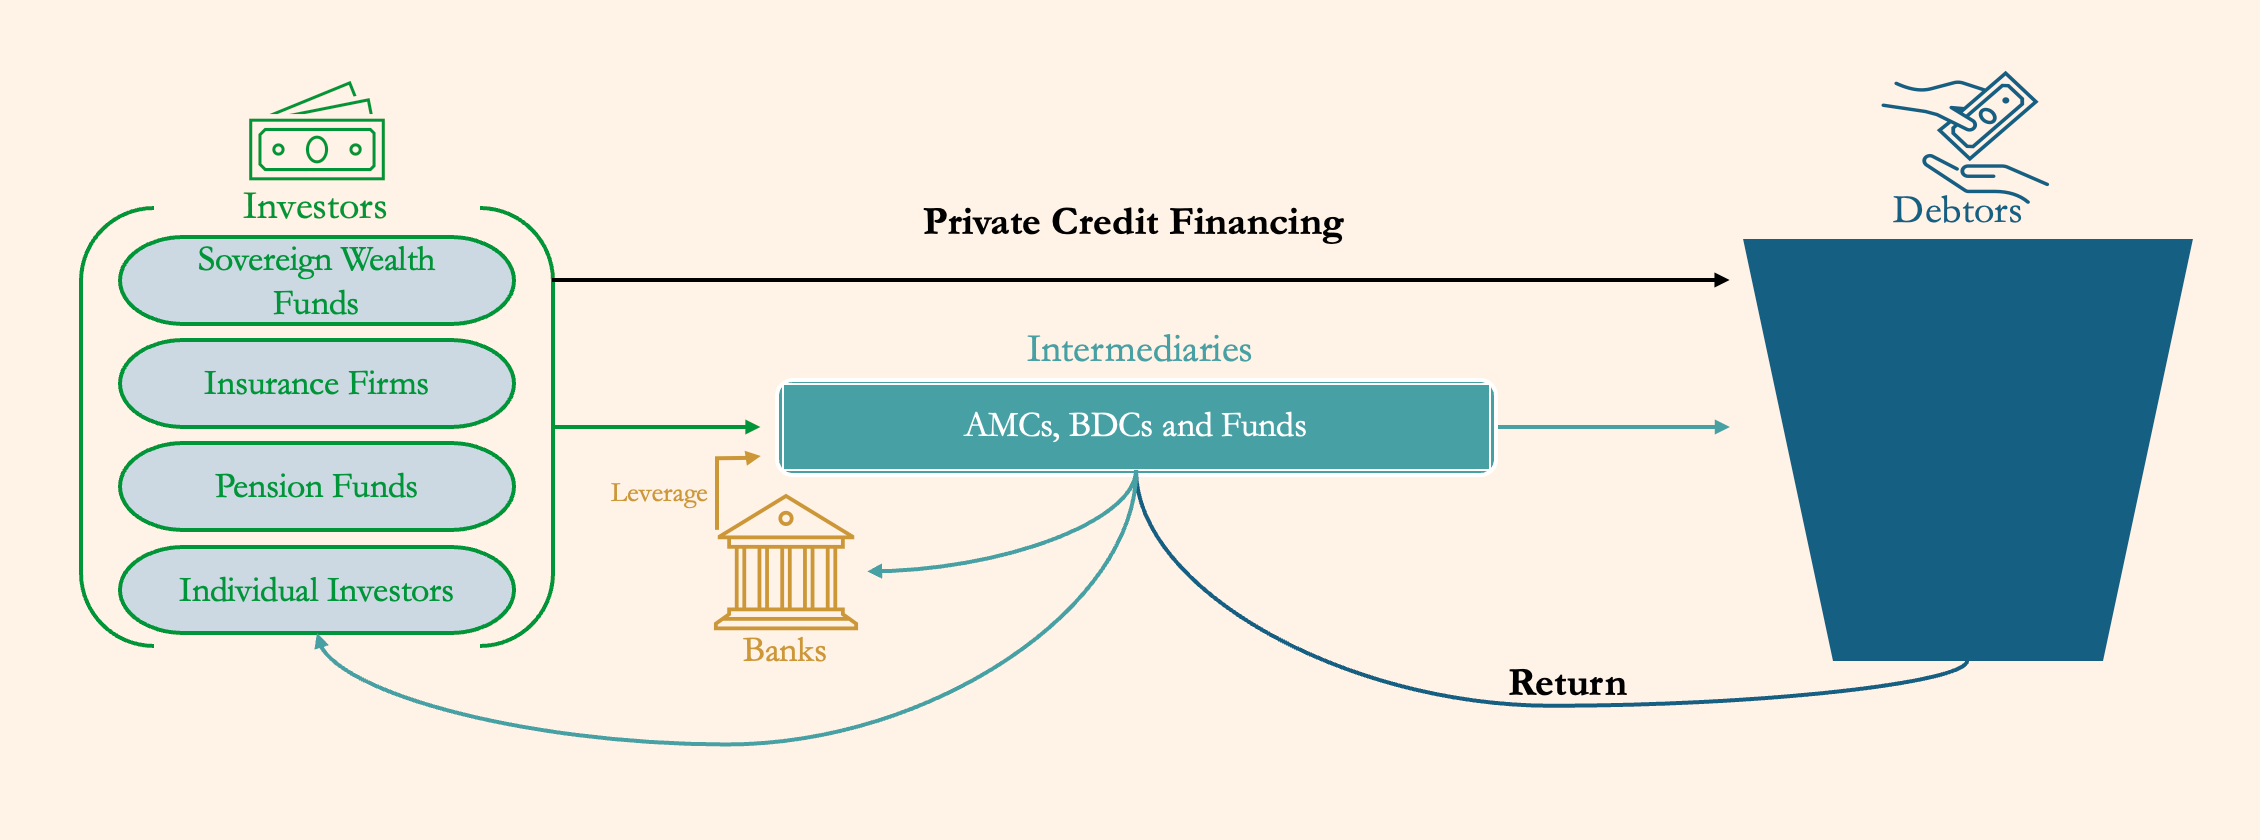
The self-explanatory diagram is somewhat of a simplification but will work famously for our purposes of conceptual overview. We would only mention that investors are limited partners, under the umbrella term of ‘intermediaries’ are the general partners and specifically BDCs refer to business development companies. Umbrella term was used deliberately, as rarely in finance something happens without intermediation, asset managers of private credit investment vehicles intermediate between investors and companies receiving financing, in private placements it happens via investment bank and/or AMC participation, conversely there are instances of disintermediation as with CPP CI* unilateral private credit underwriting and deployment, but it’s more of an exception than the rule.
Let us pick another low-hanging fruit, while we move on, by showcasing capital deployment process of an asset manager.

*A Canadian pension fund - Canada Pension Plan Investments, Credit Investments unit
To illustrate how PC works, we’ll first present a simple flow of capital, in a similar fashion to diagram above, then breakdown various segments of private markets that PC participates in, by describing what asset classes are involved and what they are, from the perspective of PC.
Diagram for illustrative purposes of the flow of capital:
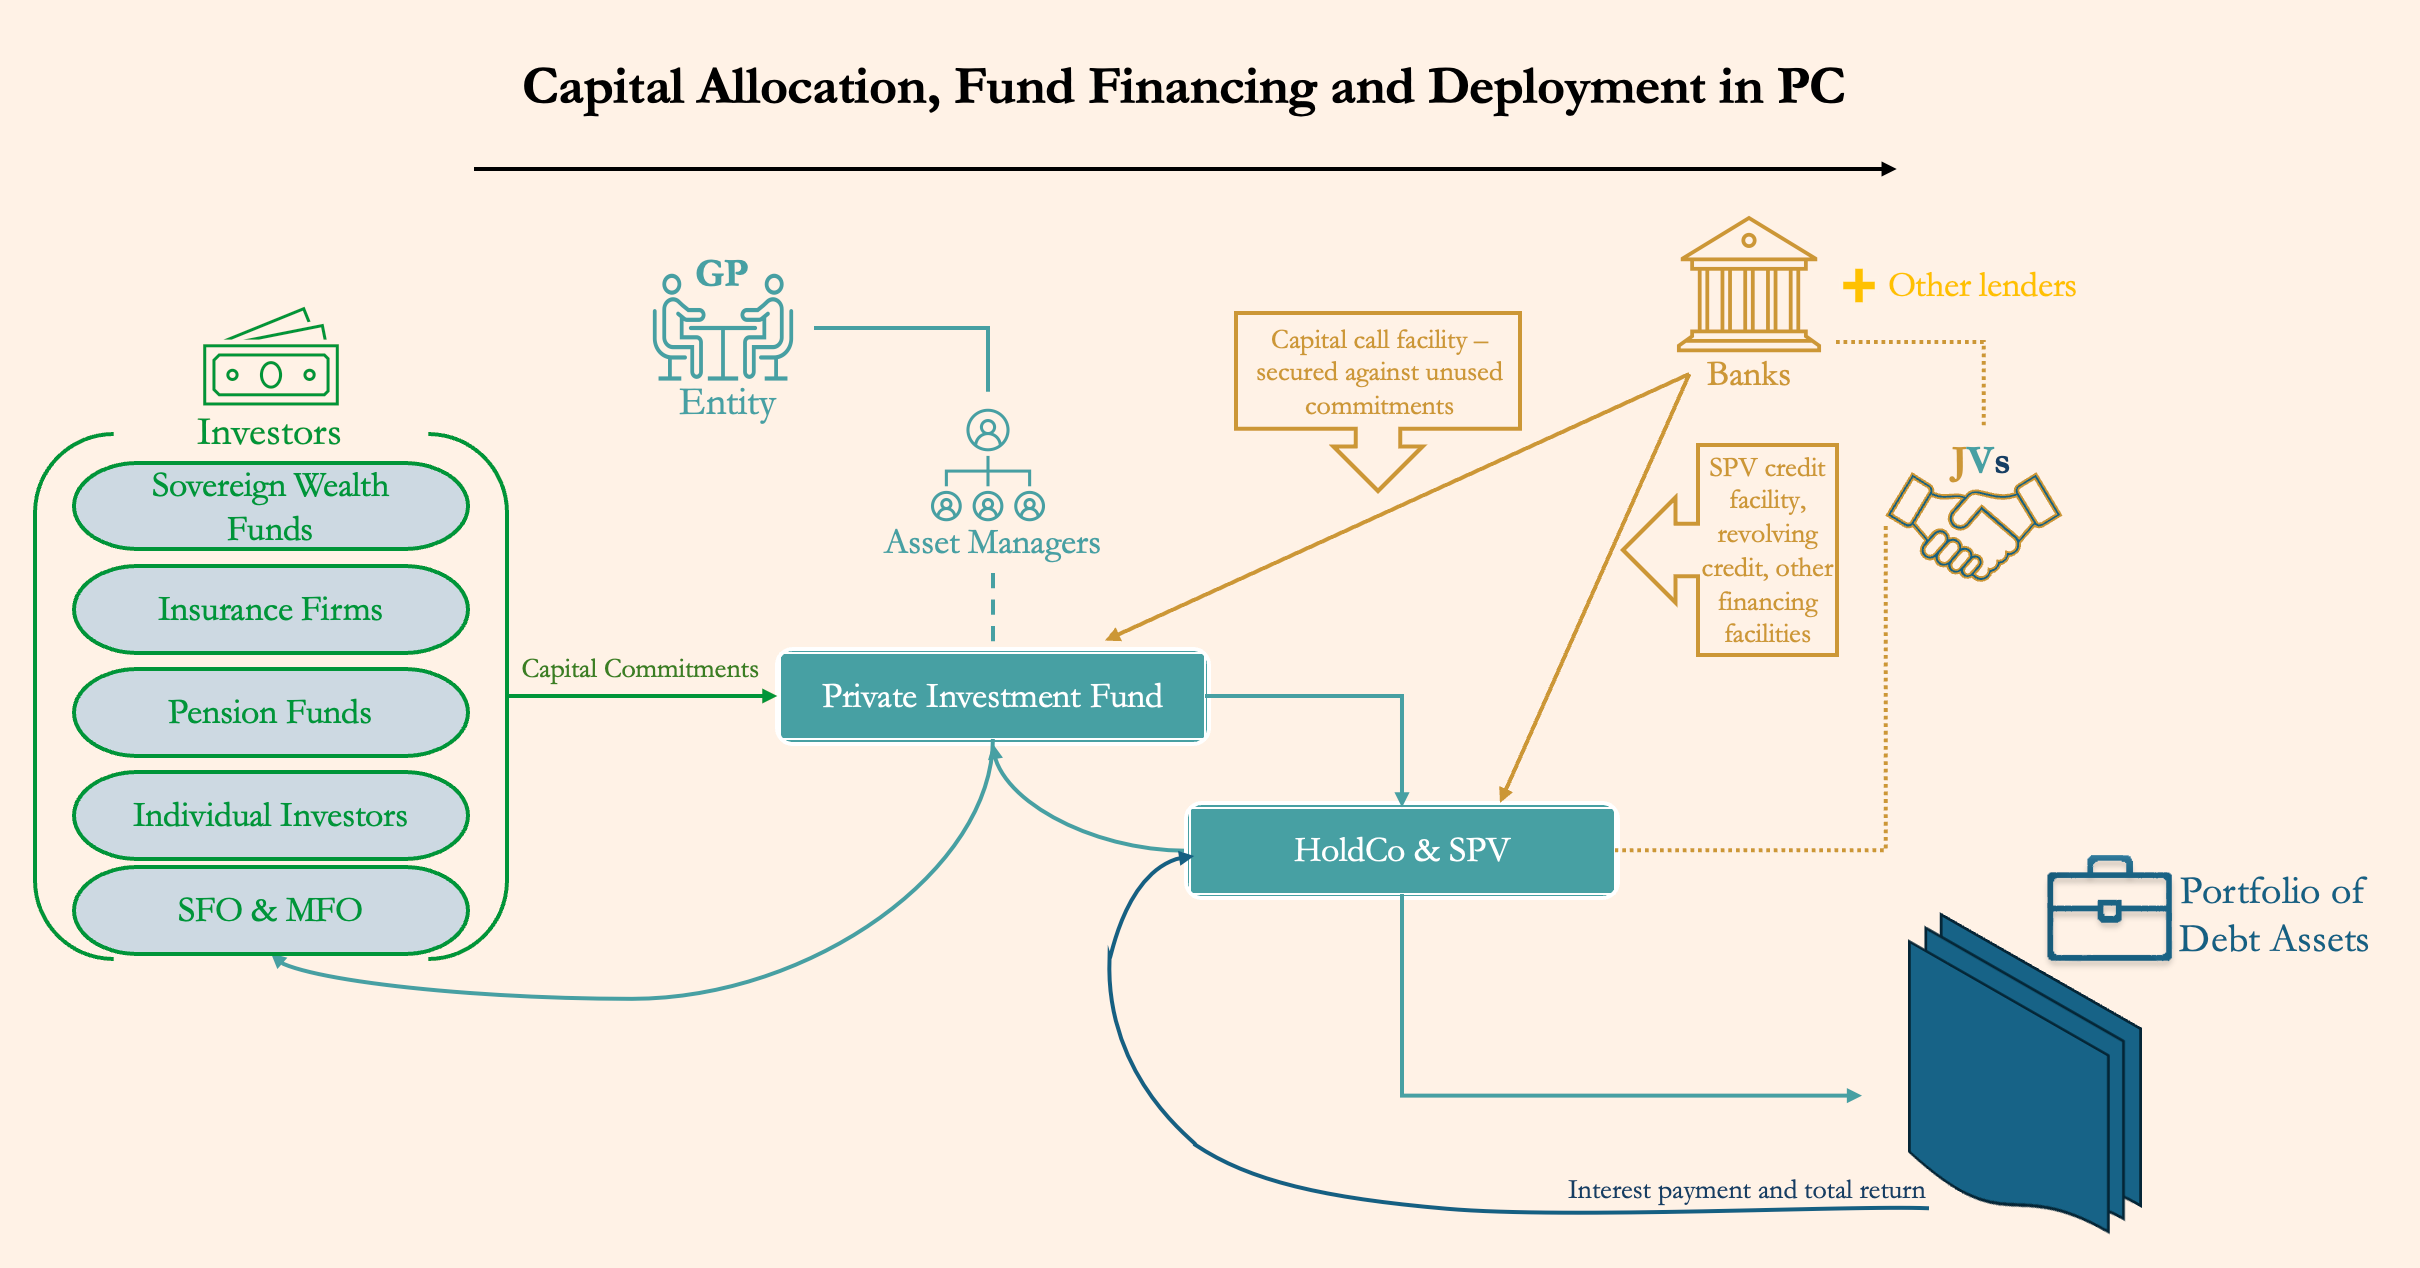
The easiest way to look at it is through the lens of familiar VC funding structure, or rather their familiar similarity, same idea – LPs provide capital and GPs pool capital into a specific funds, then the asset managers of a fund allocate, or in our case deploy capital by originating debt financing. Simple, right. Well, as with VC investing, there is more nuance. Borrowings under credit facilities are used to support the private investment funds, commonly in the form of capital call facilities on LPs capital commitments, to provide liquidity, efficiency in origination and bridge financing in general, often referred to as subscription-lines or subscription facilities. This is the standard leverage that is offered to the funds, since LP commits capital or subscribes to the fund, but actual cash contributions happen on a different timeframe – on capital calls by asset managers. Subsequently, several other credit facilities are used, SPV facility where loan portfolio works as collateral, alongside other back-end leverage revolving credit facilities and other financing facilities depending on the type of fund in question, together as a form of leverage in fund finance structure to ultimately increase private credit fund’s returns.
Important note on seniority of debt:
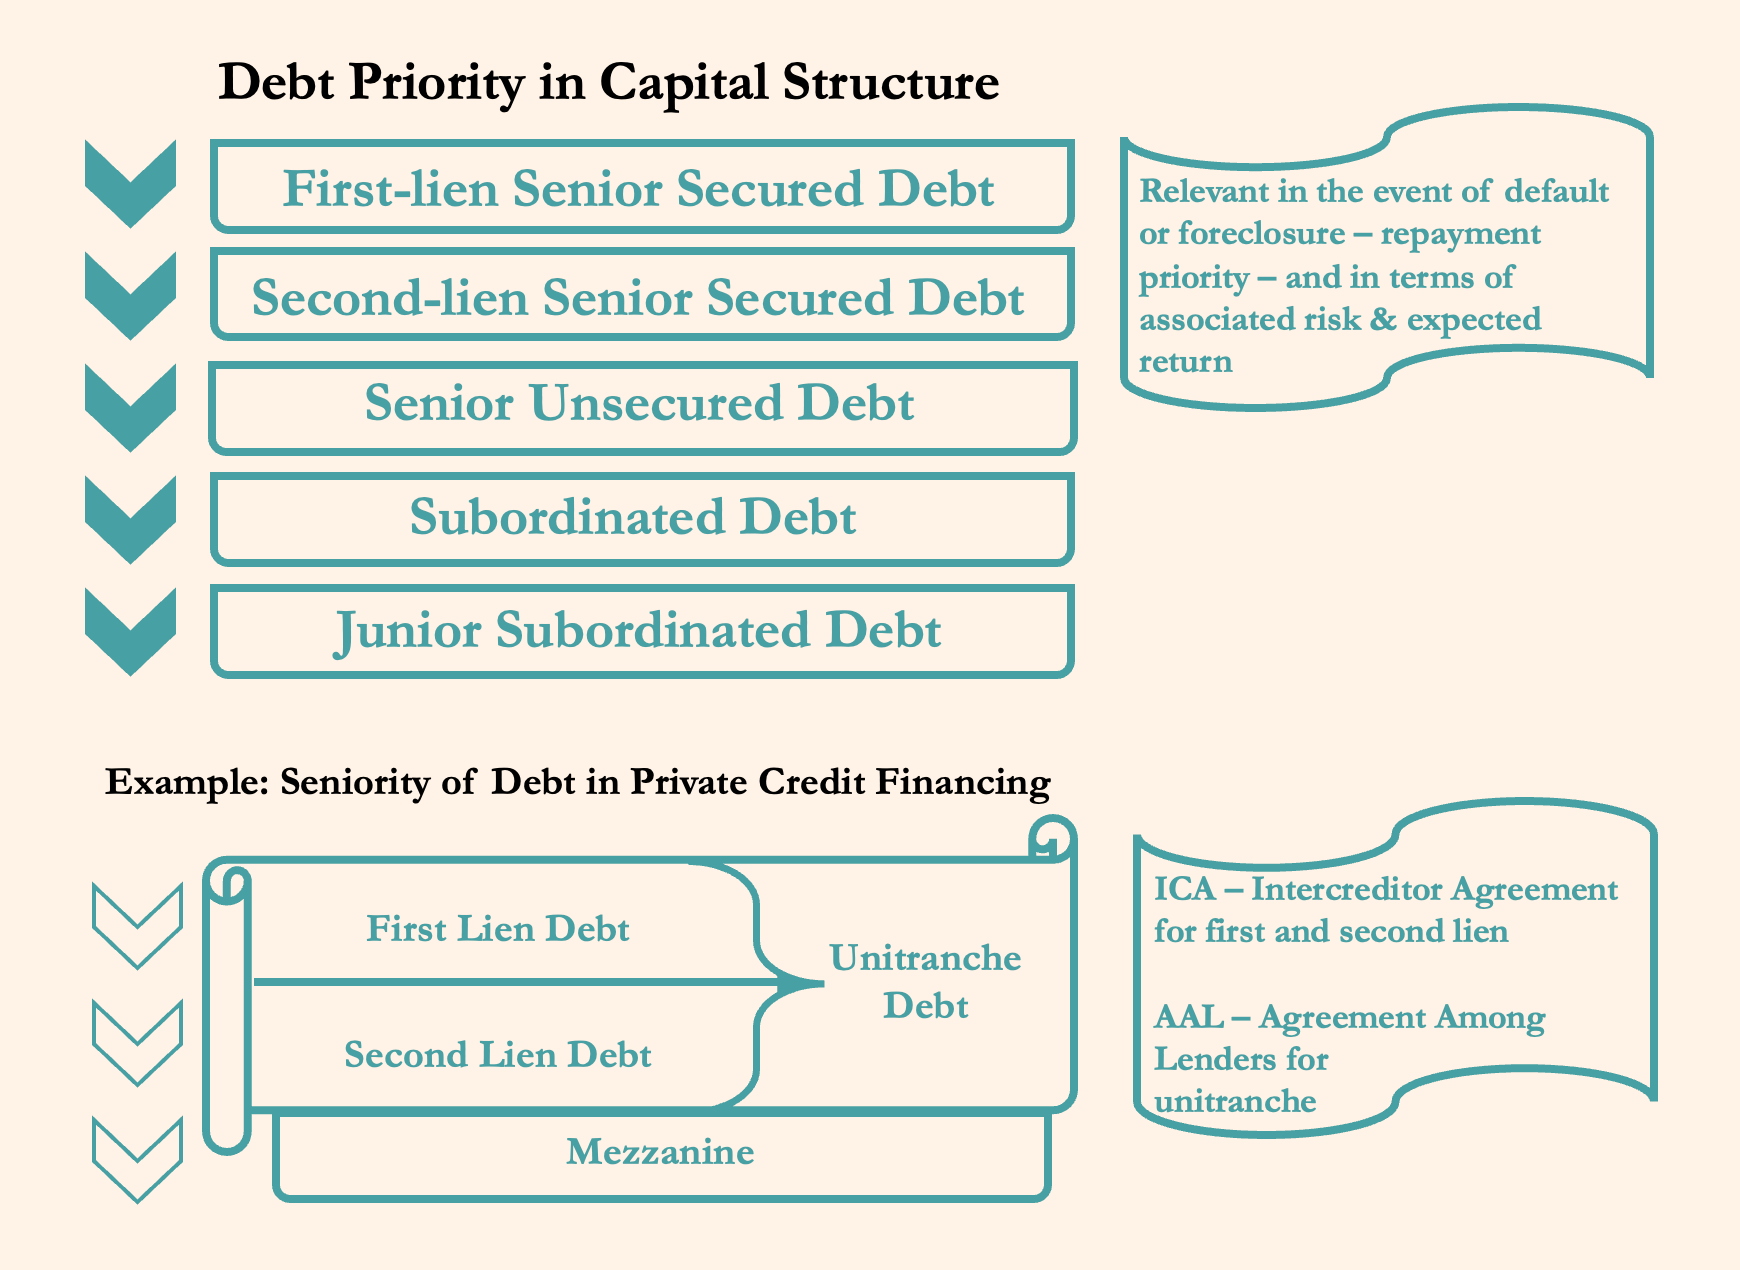
The goal here is not to cover the entire credit market debt instrument structure, but to provide a fraction more detail than straightforward senior and junior debt, in the context of private credit. Senior is ranked highest in pecking order of capital structure, and can be subdivided into first and second lien, it can have different tranches and be secured or unsecured. After first-lien all other debt is subordinated, which is important to note in the context of collateralised loan obligations (CLOs) in which the waterfall mechanism is used, this effects the distribution order of cash flows and the risk associated with the collateral. Unitranche is nominally pari passu, creating single secured loan facility, facility often used in PC. Conversely, de facto in the Agreement Among Lenders (AAL), a type of first lien-second lien hierarchy of distribution of economic risk and benefit found in the Intercreditor Agreement (ICA) is established by lenders in unitranche, in the form of two-tranche structure called FOLO, i.e. where lenders have (senior) first-out and (junior) last-out tranches. This topic goes somewhat outside of the scope of our discussion, and we had to simplify FOLO and unitranche for our purposes, since former is more nuanced and the latter not always a bifurcated structure.
However, it is essential to keep in mind the seniority order of debt as we begin to discuss the differences between the asset classes of private credit, as it has direct impact on associated risks and returns of those asset classes.
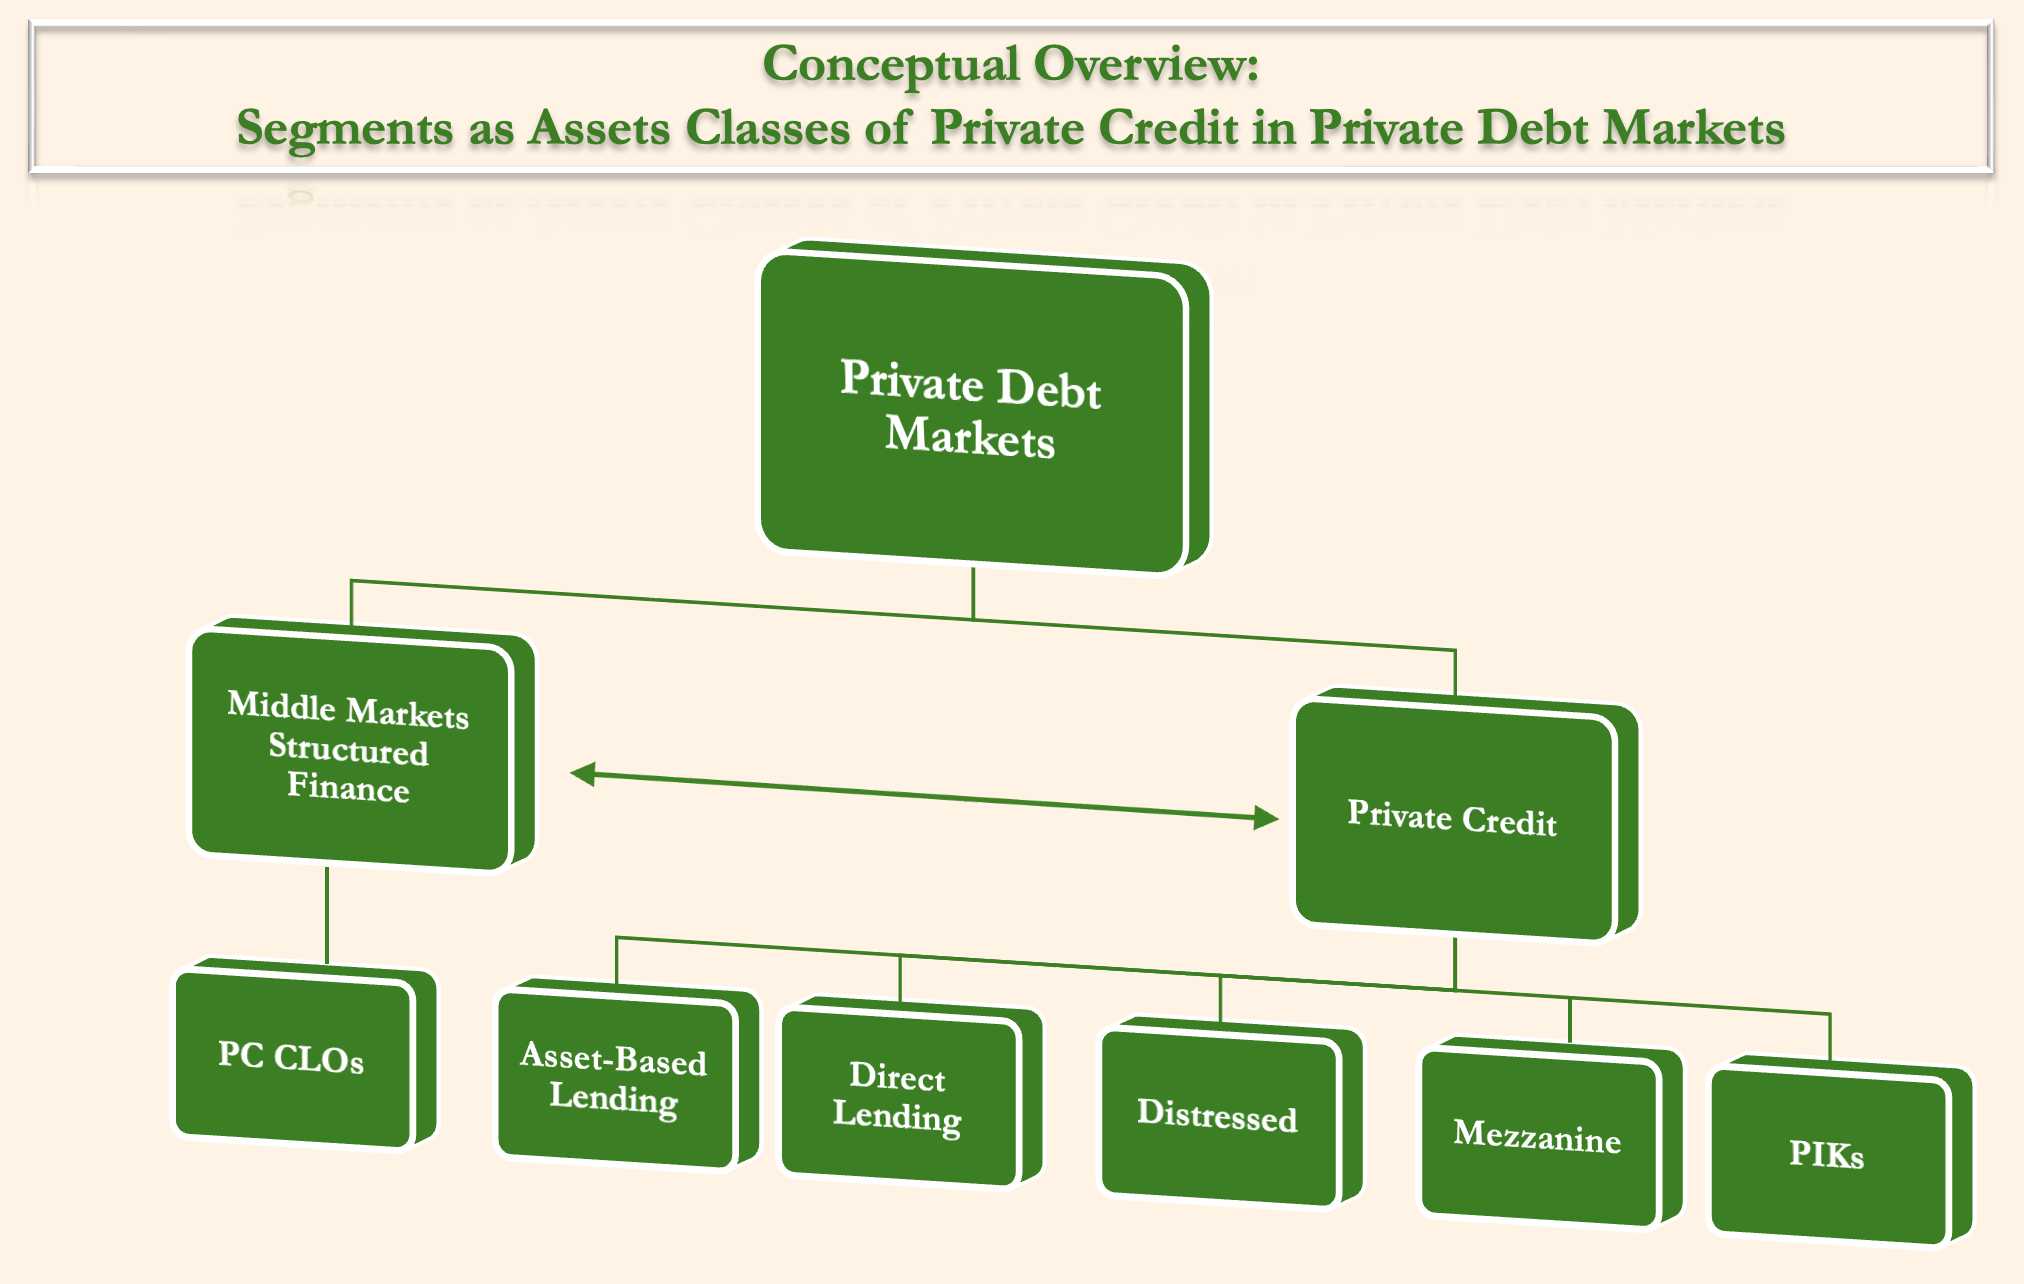
All these categories of asset classes are broader than just private credit financing, most go beyond private markets, but we’ll isolate our discussion in direct relation of these segments to private credit. PC loans are tailor-made to accommodate specific needs of a given business with great specialisation in structuring and flexibility in both financing and servicing. This gives rise to loan complexity that often overlaps and combines several features in one. To demarcate the distinction between PC asset classes we’ll rely on straightforward examples.
Direct lending – is extending credit directly to privately* owned business entity, typically to a business with a range of US$5mn to US$100mn of EBITDA. These loans are floating rate with periodic interest payments with principal paid at maturity (bullet) providing a hedge against inflation, or rather the monetary policy tightening. The loans are borrower-entity dependent, i.e. backed by assets and cash flows from operations of a particular juridical entity with strict covenants to ensure stable performance and continued ability to service the debt, to protect against downside risk. Predominantly first-lien, senior debt or unitranche facilities are meant when talking about direct lending in the context of private credit. It is noteworthy to mention, that sponsor-backed direct lending is where private credit connects with private equity, either by providing financing for leveraged buyout or ‘leverage-on-leverage’ in dividend recapitalisation, or doing both.
*Direct lending can be provided to public and EBITDA US$100mn+ entities (deliberate delimitation for illustrative purposes)
Mezzanine – is subordinate to all other debt in the capital stack, i.e. a junior debt. This type of lending has equity conversion rights via warrant at stipulated price allowing the originator to participate in the upside of equity appreciation. Generally speaking, mezzanine in many ways is similar to preferred stock, but with one important distinction that even with equity participation it is classified as debt, as opposed to preferred shares that are classified as equity, making mezzanine senior to equity. Original issue discount (OID) and PIK (payment-in-kin) are often part of mezzanine structures.
ABL – is part of a broader ABF, the difference between the two? One ends with lending, the other with finance…just a jest. To make this even more confusing there is ABS (ending in securities), and these, at least, we can separate solely to public markets. Now, before we delve into particulars between the two, the most important aspect to remember about asset-backed Ls & Fs is that they have a unique distinction to direct lending, latter can be secured or unsecured, former is always secured and on top of that the exposure is not to the juridical entity itself, but to particular assets which should be isolated in case of insolvency and be first-lien senior secured debt. Generating cash flow from underlying assets the loan is usually amortising i.e. interest and principal are paid over the term of the loan. The difference between ABL and ABF, in our opinion, is that while former is lending based on assets, the latter is financing based on assets i.e., with asset-based finance one can pledge unprocured equipment as collateral for financing to purchase said equipment, when assed-based lending requires ‘existing’ assets on the balance to extend debt.
Distressed – is about targeting financially distressed entities or more generally acquiring debt classified as distressed, for our example it will be an entity struggling financially or operationally to meet the obligations. Asset managers acquire debt sub-par to pull-to-par i.e. at discount, say 80 cents on the dollar, typically this would be classified as distressed in public markets, expecting that underlying fundamentals and debt management will ‘pull’ it closer or above par if amend to extend is used. Discounts are usually significantly higher in private markets, and there are multiple strategies involved here, often requiring specialised legal expertise from asset managers on top of the industry specialisation. To name a few, improving the stressed entity’s financial position by restructuring the balance sheet – ultimately refinancing the loan, liquidating the entity altogether – monetising the assets, or going ‘long’ in debt-for-equity transaction – actively managing the entity to make it solvent and profitable and ultimately gain on equity appreciation at exit. The latter can be classified as special situation blurring the line between distressed debt and private equity investment.
PIK – is accrual interest loan, think of it as reverse amortisation, interest on the loan is not paid in cash but instead added to the principal, resulting in an increase of the loan balance. There is limited justification to this approach, even though an argument can be made for providing this type of loan with certain guardrails and condition to nascent growth companies enabling their unhindered growth. Usually, this provision is included as part of loan arrangement representing one of components to the loan. Alas, there are pure play PIKs which are, in our opinion, from the perspective of an investor a wee bit silly.
CLO – it’s best described as derivative security of a pool of different issued loans, remember MBS’ that became infamous during GFC, this instrument (Collateralised Loan Obligation) is very similar, deriving its principal and interest from underlying different grade of loans from investment-grade (IG) to HY (high-yield). We will concentrate exclusively on middle market CLOs, or now coined PC CLOs. Derivative cash flows from the pool of assets are divided into tranches depended on the loan seniority, or rather into modified seniority tranches, also known as waterfall methodology. Waterfall is quite straightforward method, perhaps in need of illustration for seamlessness of comprehension:
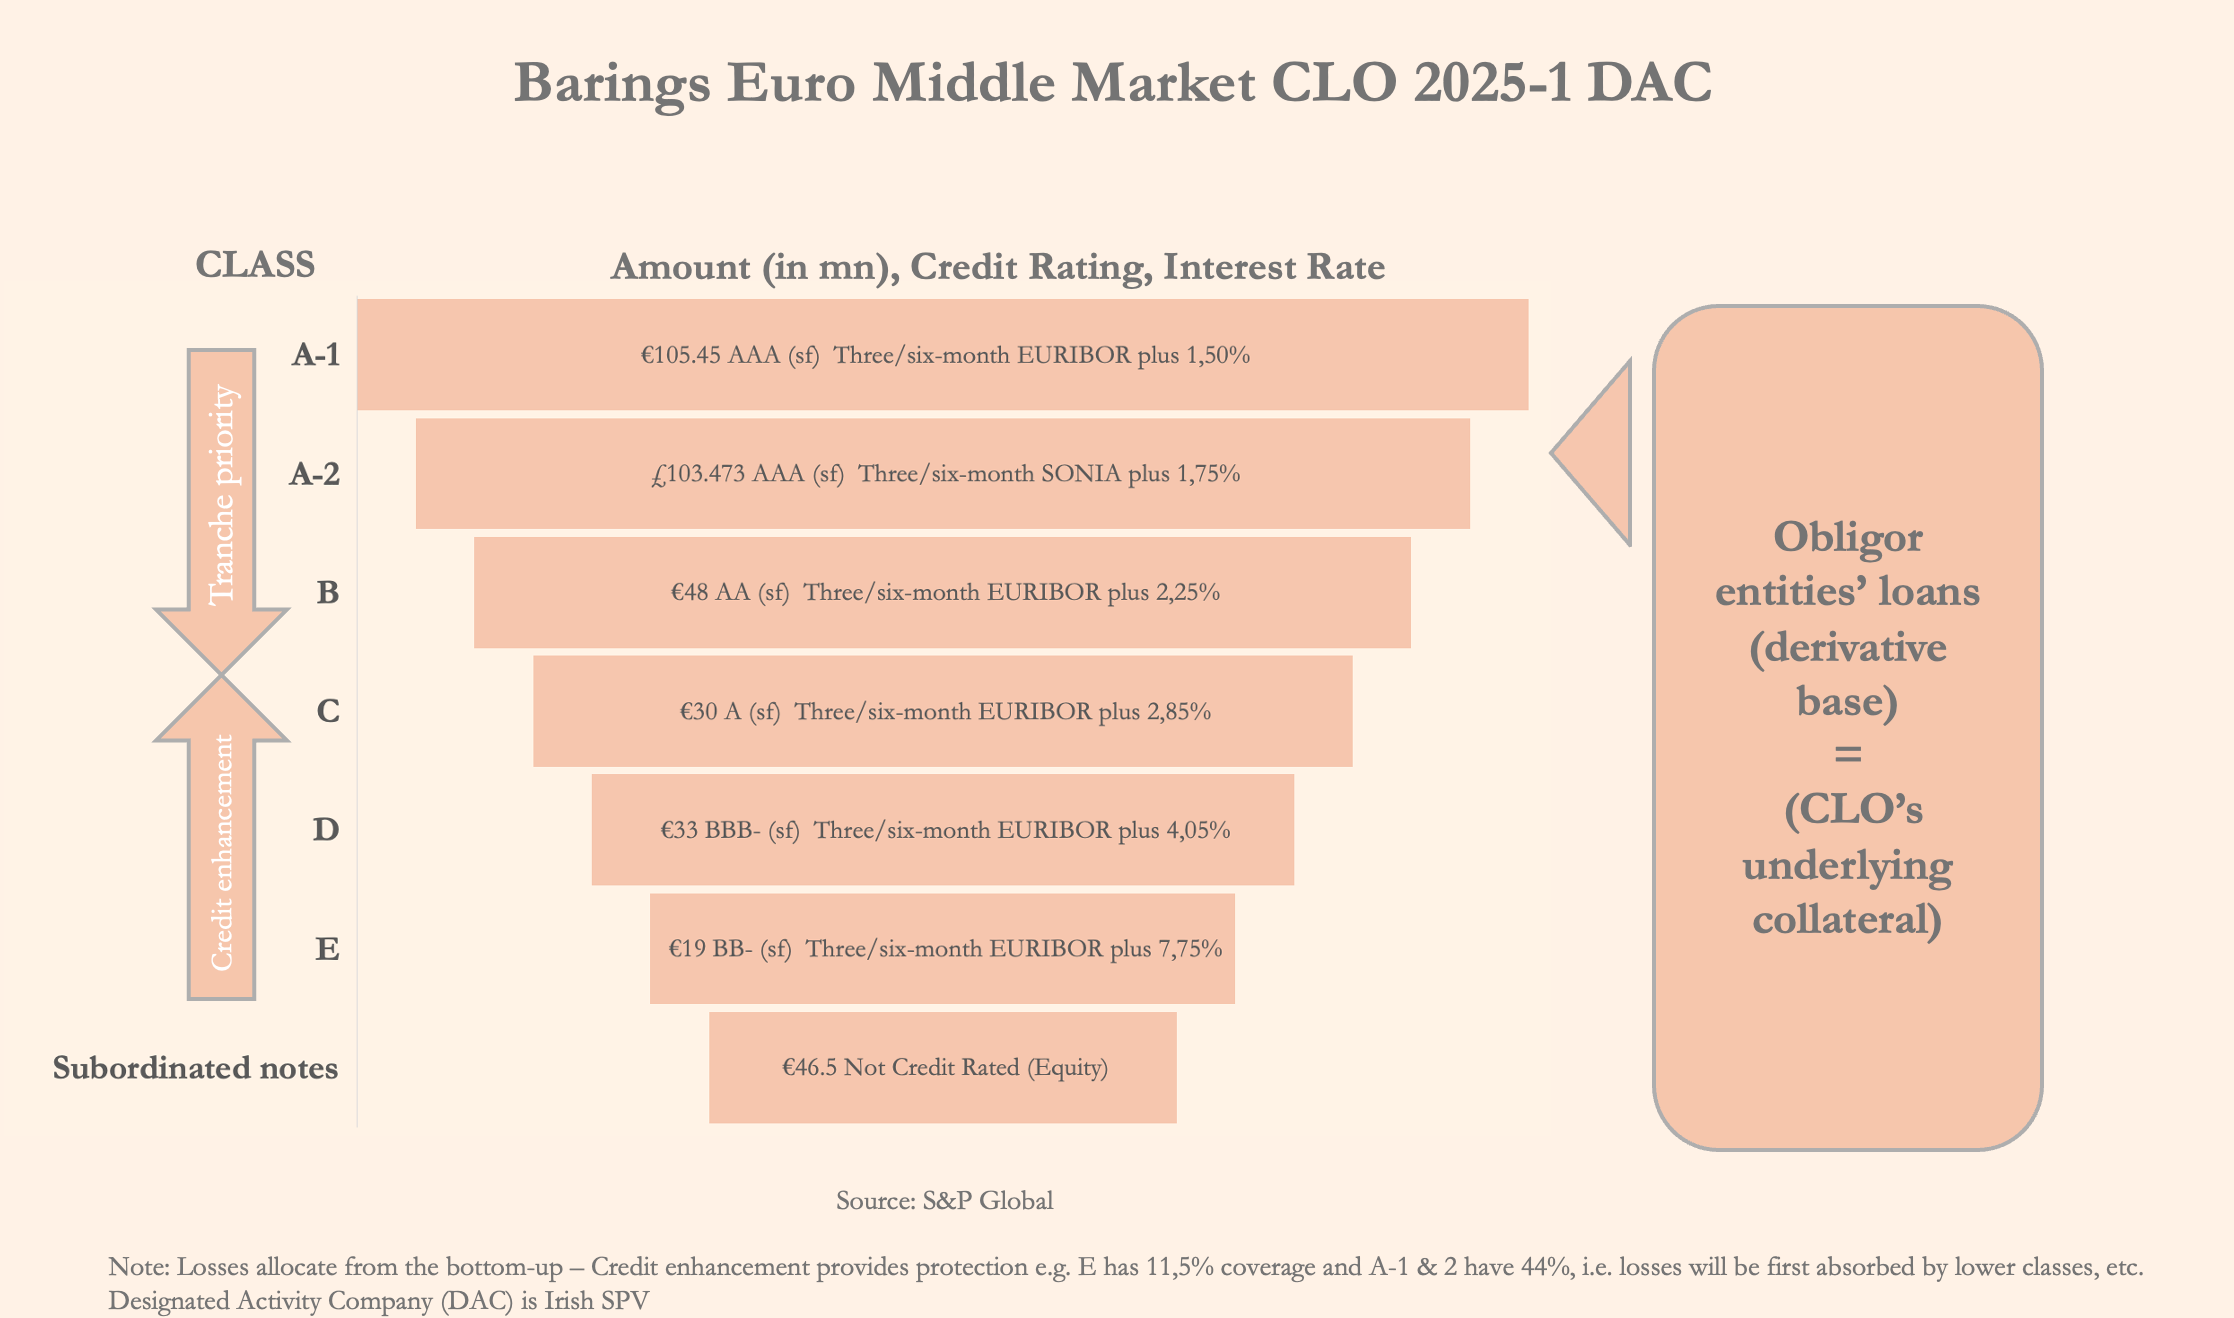
Important to note here is credit enhancement, say you have 44% for A-1 & 2, it is made possible because excess spread, overcollateralisation and subordinated tranches absorb the risk first, i.e. difference between coupon payment to investors and average collected interest on collateral, par value of collateral loans is higher than the total par of issued tranches providing us with a cushion, and finally, and most crucially A-1 & 2 is protected by 44% of the total collateral loans. All this together serves as risk reduction and observes losses for our senior tranches, giving the AAA ratings to first two class tranches.
Concluding this section about asset classes we’ll laconically mentioned one additional related instrument – Broadly Syndicated Loans. Relevant to private equity and alternative investment space. Having same functionality but just higher-grade loan-pool and the fact of being issued by banks. Used to be essential components of all CLOs and exclusively issued by investment banks, neither is necessarily true henceforth as the instrument in the example is issued by Barings and is a private credit pure play.
To the relationship between the two – PC CLOs can be viewed as ‘alternative’ investment to BSLs – S. Dulake, Co-head of Global Fundamental Research at J.P. Morgan – might have said that, but we’re not sure, nonetheless this proposition is one we tend to agree with.
Market, Potential and Risks & Returns
Now we’ll turn to the most exciting part – the numbers. Here we will review the size of the private market, provide our own conservative estimate of total addressable market for PC within those private markets, highlight associated risks and conclude with sine qua non – the returns.
The Private Credit Market
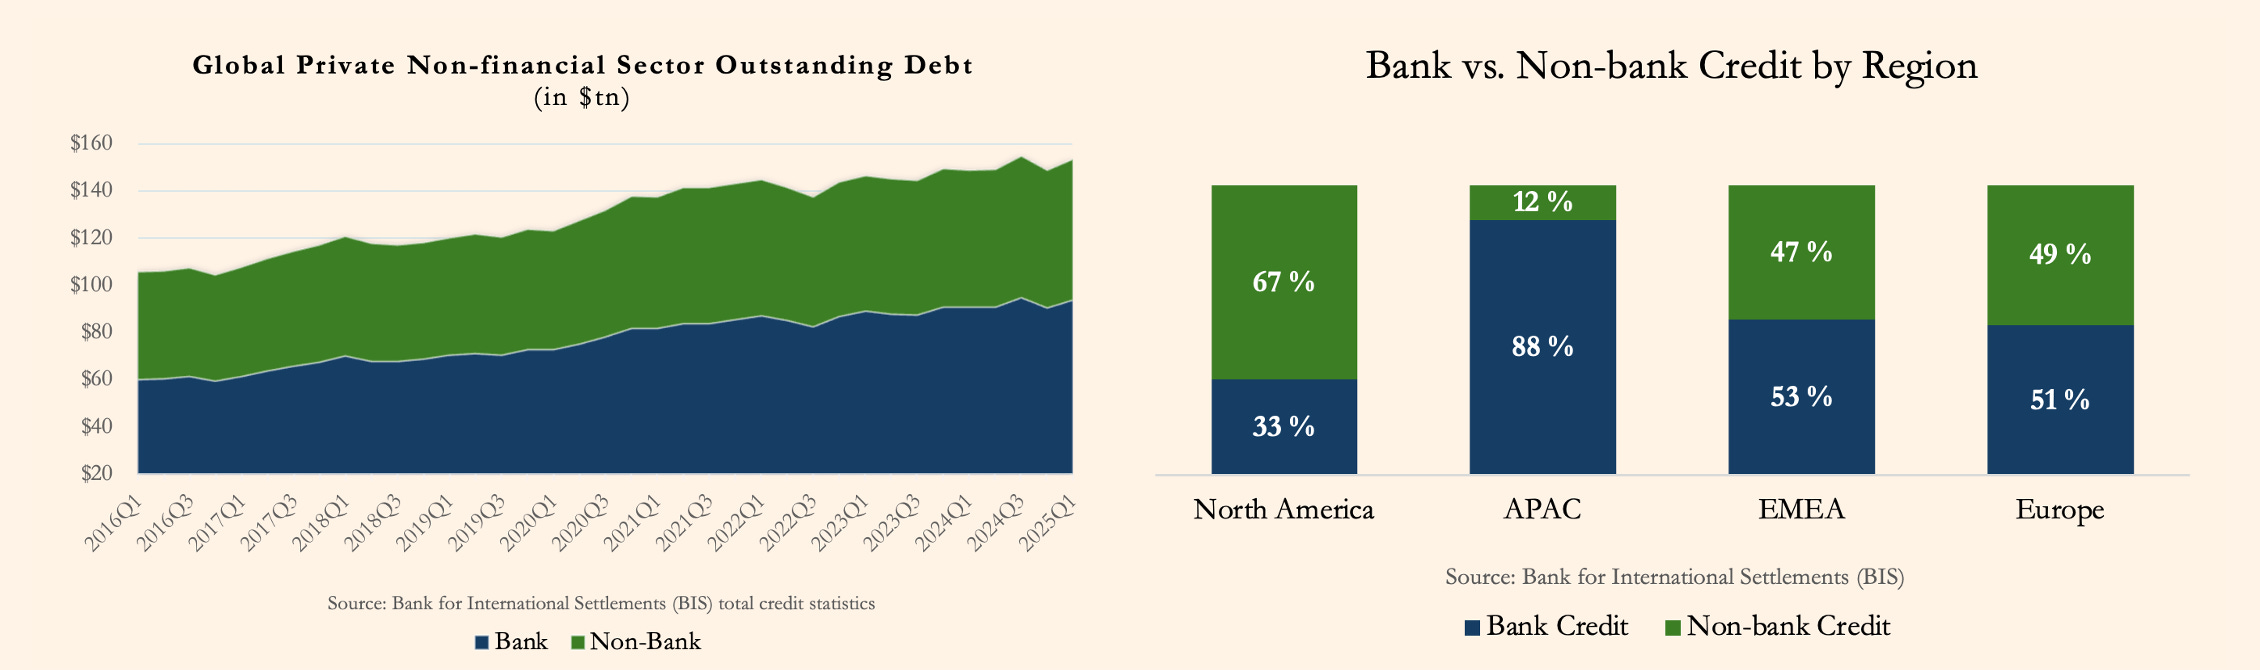
To assess the size of credit market for Nonbank Financial Institutions (NBFIs) we took a look at available data from Bank for International Settlements (BIS)1, total credit to private non-financial sector (PNFS) which incl. e.g. households, but excludes government sector, thus not distorting the data with sovereign barrowing, that would account for $90tn2 in debt at market value for our sample3 of major economies.
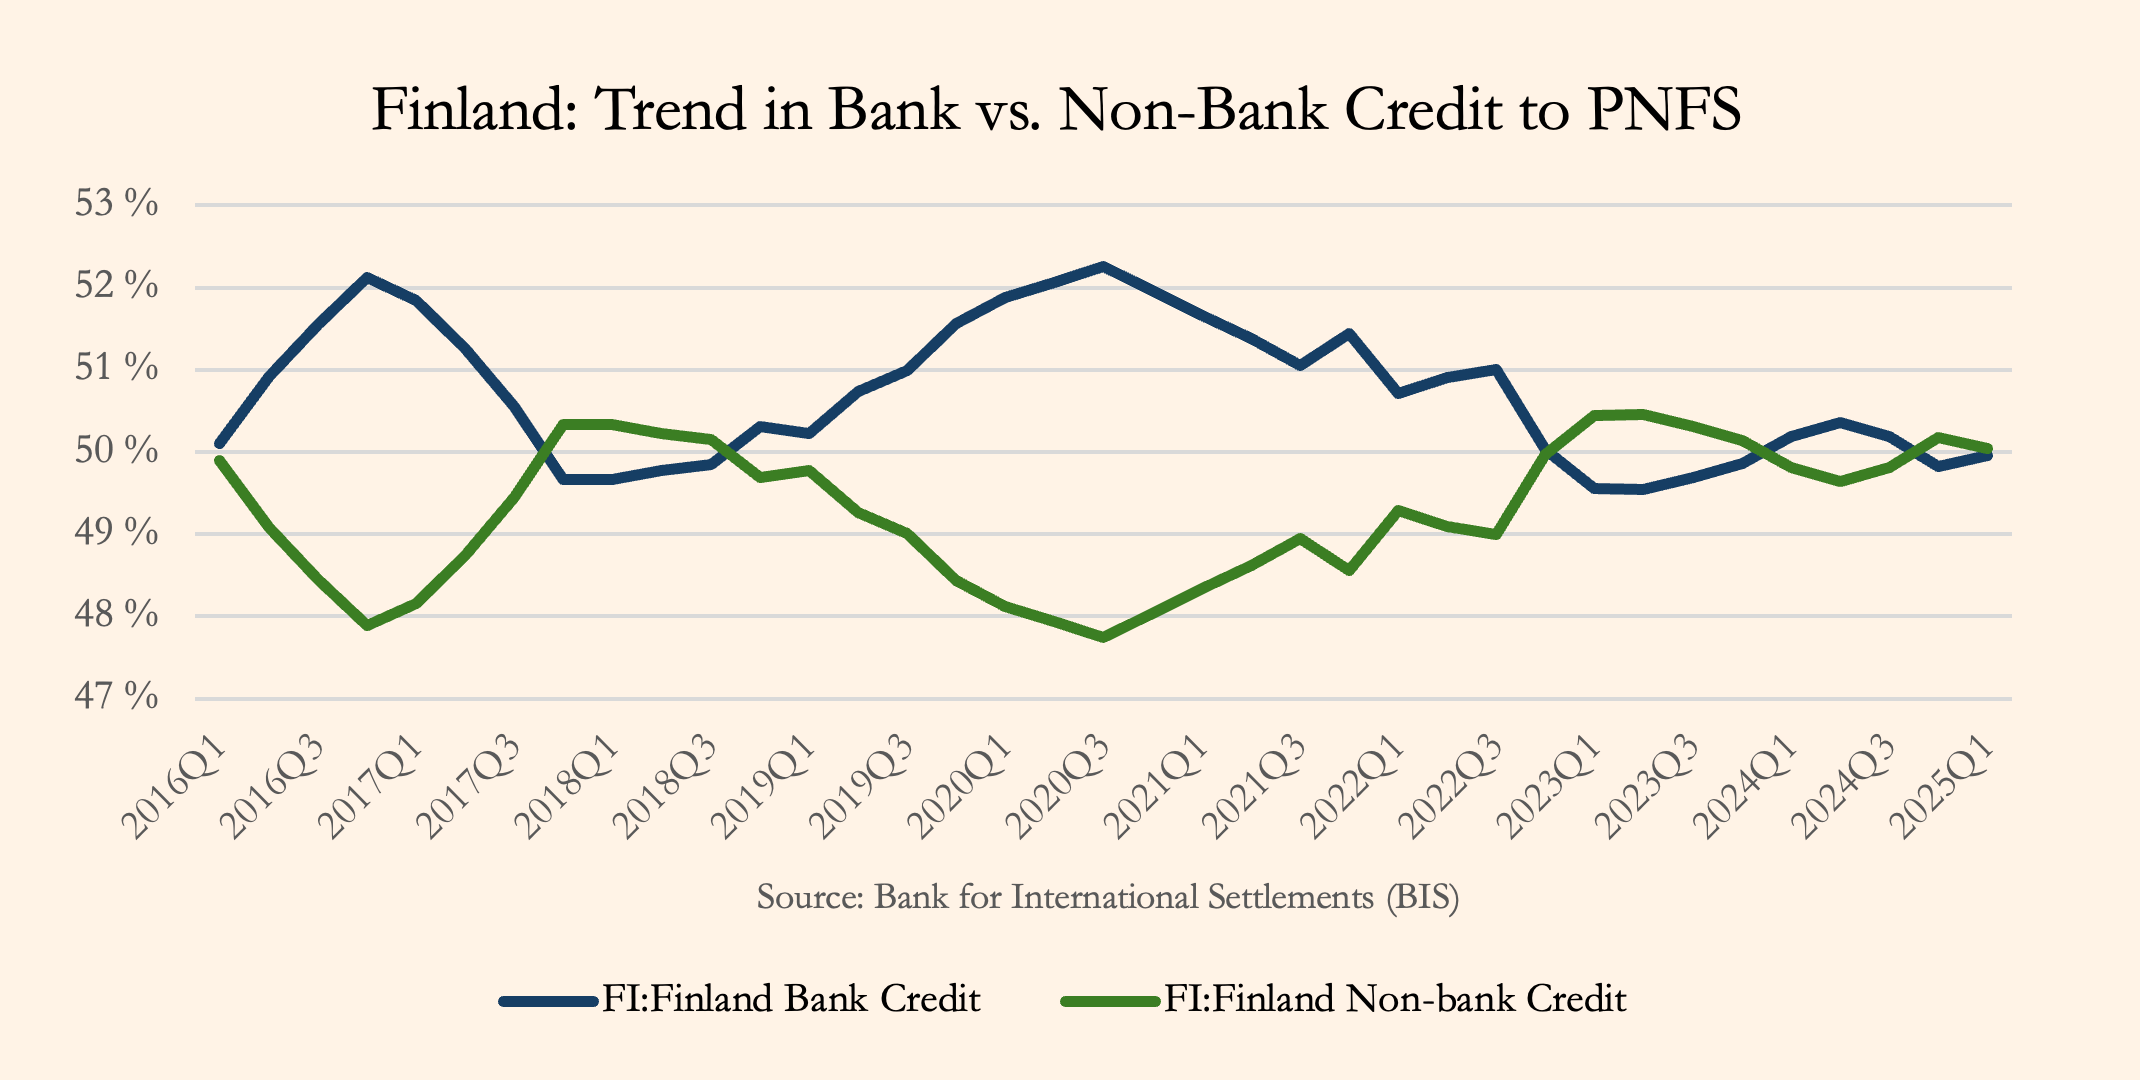
Gathered data suggests that non-bank institutions have materially overtaken traditional lenders in loan origination in North America, in Asia-Pacific by contrast banks originate nine in ten loans, with Europe keeping balanced approach of 50/50. Europe, Middle East and Africa have limited amount of African and Middle Eastern countries in the sample to be representative of that region, but even with a few larger economies included from the region we see subtle but visible change in the dynamic in banks’ favour, and we believe adding more relevant countries would only increase the banks’ share in the region.
However, there are limitations to the data to make assumptions about PC, total households(+NPISH) barrowing for our sample is $60tn as of Q1 2025, in certain economies it would be isolated predominantly to domestic banking, enabling us to claim that significant proportion is captured in bank segment, but in other economies it is not so, as NBFIs provide increasingly mortgage loans and other types of financing to households, such as vehicle financing.
In line with our promise of non-granular analysis, and due to constraints in data granularity, we are unable to provide disaggregated pro rata households barrowing between banks and nonbanks, but we can make credible adjustments to the numbers and interpolate them in accordance with figures provided by Financial Stability Board (with ominous acronym FSB). FSB reports4 on Other Financial Intermediaries (OFIs) that are subset of NBFIs, and within that subset there is another – Other Investment Funds (OIFs), and since that subset doesn’t provide mortgages – we will take a look at the composition within that group.
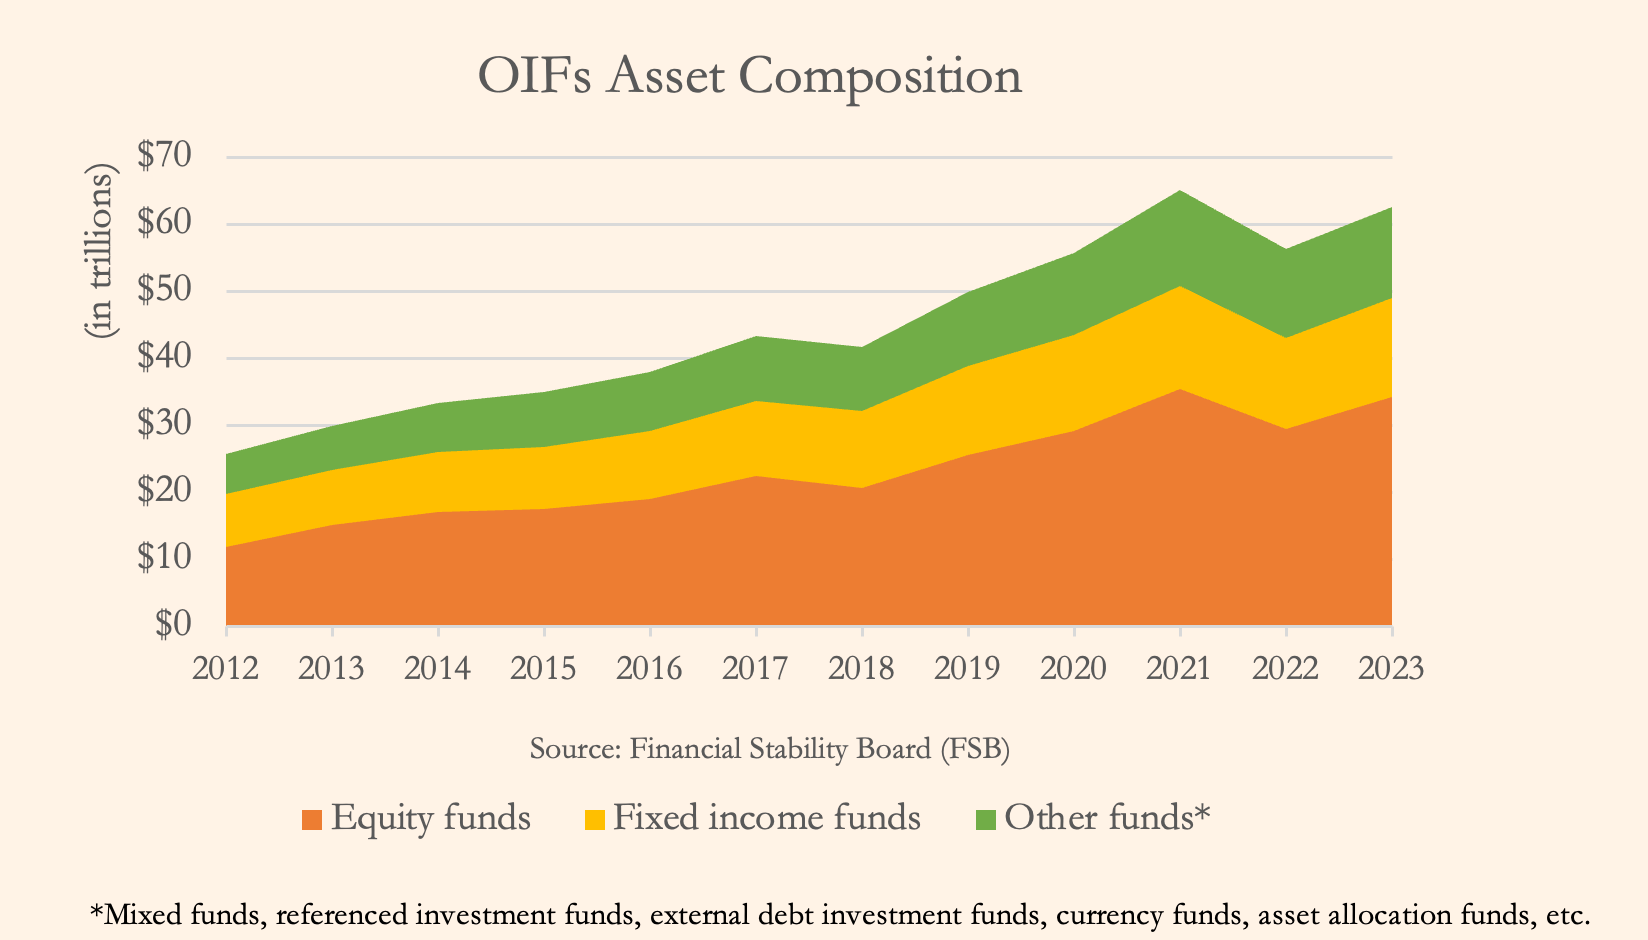
The total composition of assets under management, incl. credit assets, of the constituents in this subset was eye watering US$63tn at the end of 2023, OIF constituted 27% of total AUM of NBFI sector contributing the most to the sector’ growth.
We believe that an estimate based on measurable data from the sector where private credit as alternative asset class operates in, is better option than saying corporate lending is x therefore addressable market is y or aggregated revenues for certain size private companies in selected geographies is x. For this estimation we incorporated structured finance vehicles (SFVs) to the credit assets of OIFs adjusting to our assumptions and with quite generous estimation we came to a potential total addressable market of US$17tn* as of the end of 2025.
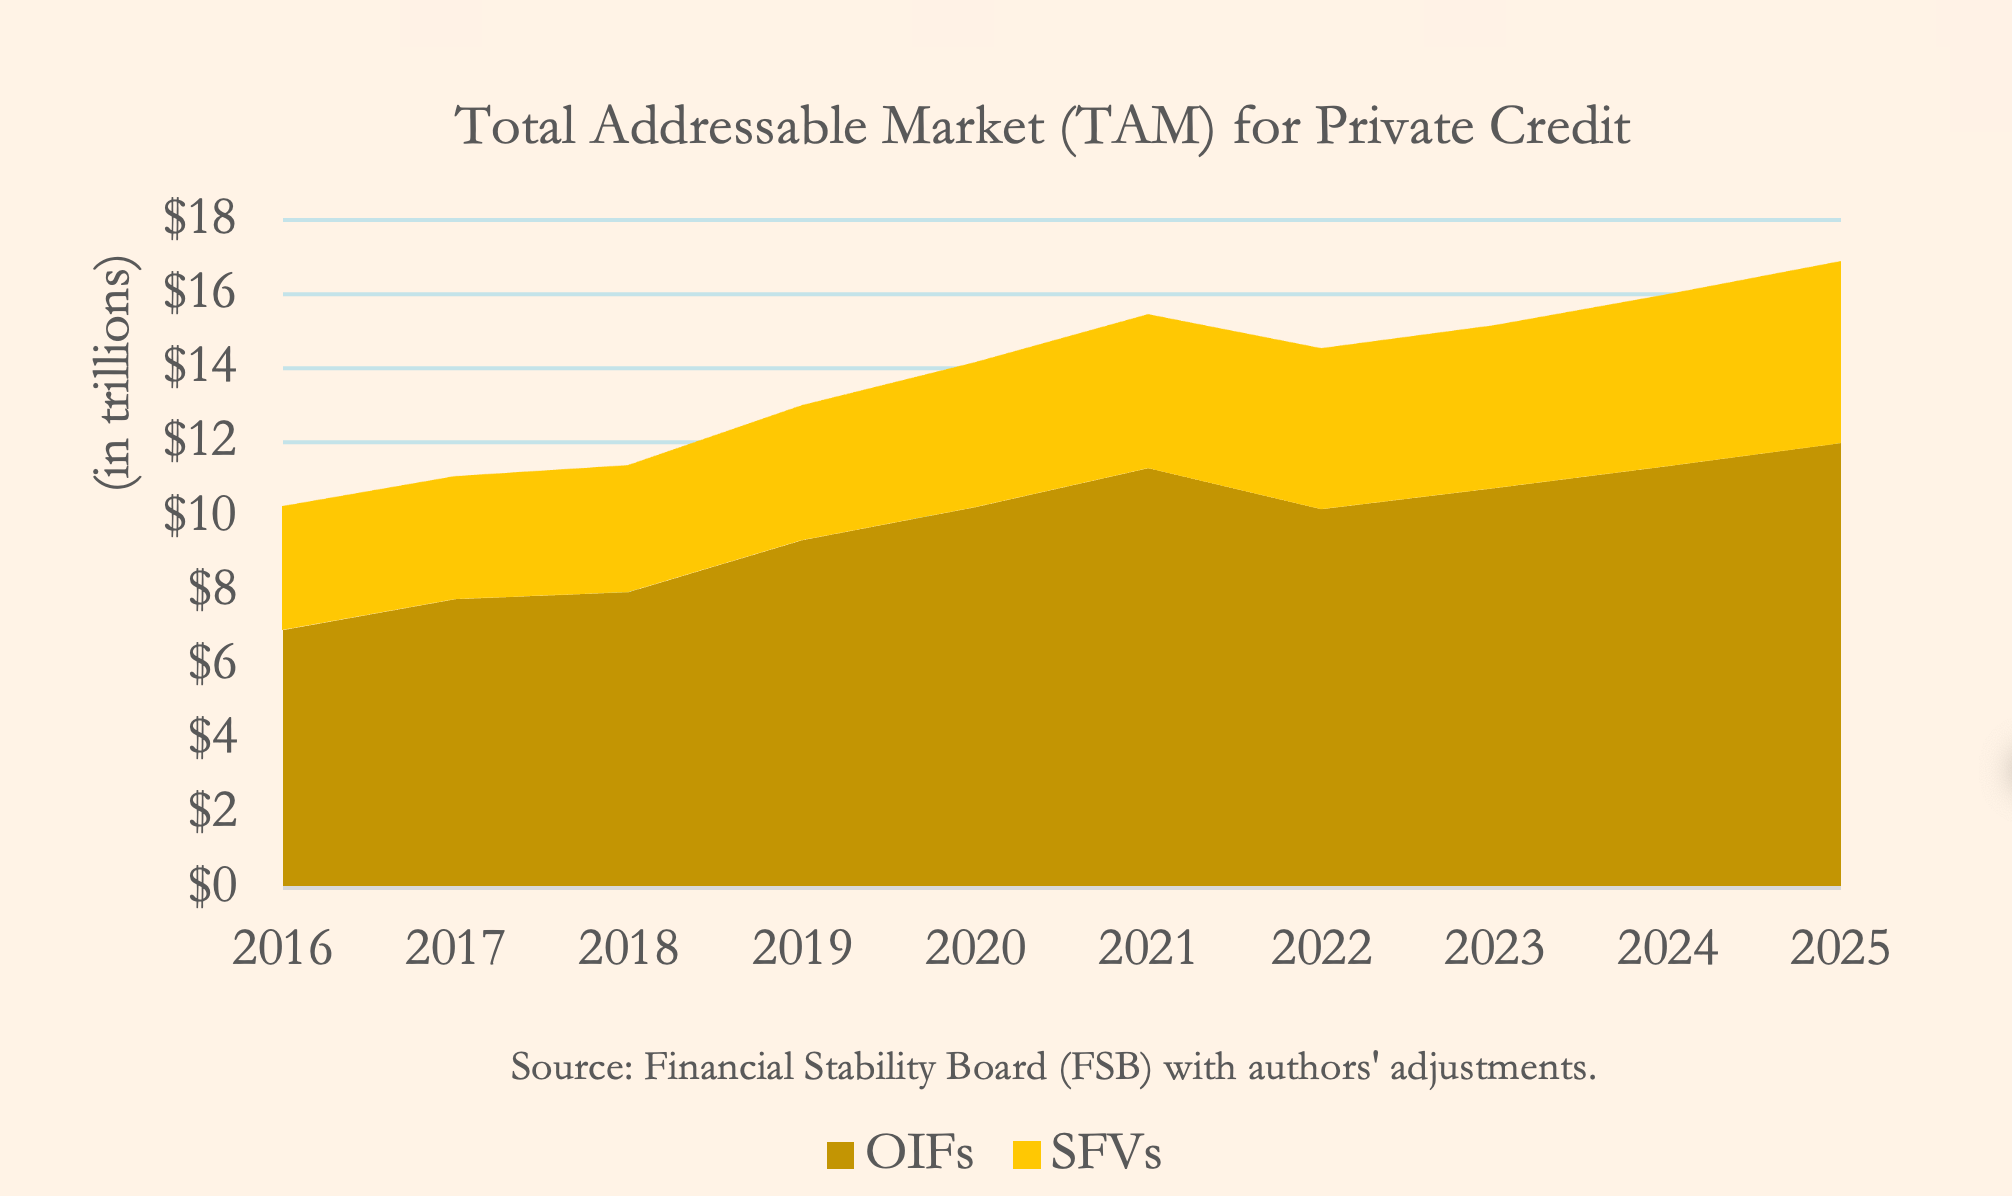
*Serviceable obtainable market (SOM) closer to $US7.5tn, if we’re being realistic about this.
Although being very generous with our estimations, we are however being conservative in contrast to exceptionally high estimates by others, namely McKinsey with their – ‘addressable market for private credit could be more than $30 trillion in the United States alone’ – fair enough, they’re known for their expansive assumptions, how about Apollo then – ‘We view private credit as a $40 trillion market’ – we do get that promoting positive sentiment and interest in clientele is quite natural and that TAM is used to showcase the overall addressable market, alas this is what prompted us in the first place to make our enquiries regarding market size.
Bank of England (BoE) this December reported on research conducted by Morgan Stanley suggesting that AI infrastructure spending between 2025 and 2028 will be $2.9tn and supported by BoE’s market intelligence on the rising expectations of spending, it is estimated that $800bn will come from private credit financing. Otherwise, we expect PC to globally grow to US$3.245tn in AUM by the end of 2028, being bullish towards opportunistic undertaking there is potential for US$3.433tn in AUM, given further monetary policy easing and cyclically stable macro-economic conditions, with former there is more confidence, as latter is shrouded in mystery. It’s worth noting that significant funds inflows can come from integration of retirement accounts (401K) and broader retail investor participation globally, from mass market to affluent individuals, but this depends on regulatory environment and ‘democratisation’ of alternative investments, i.e. structuring accessible instruments with greater protection against litigation. Different estimates exist for current global AUM of PC, reviewing findings of several credible institutions we can say that the range is from US$2.3tn to US$2.5tn in AUM. We used data available to us for our estimates and subsequent forecasting.
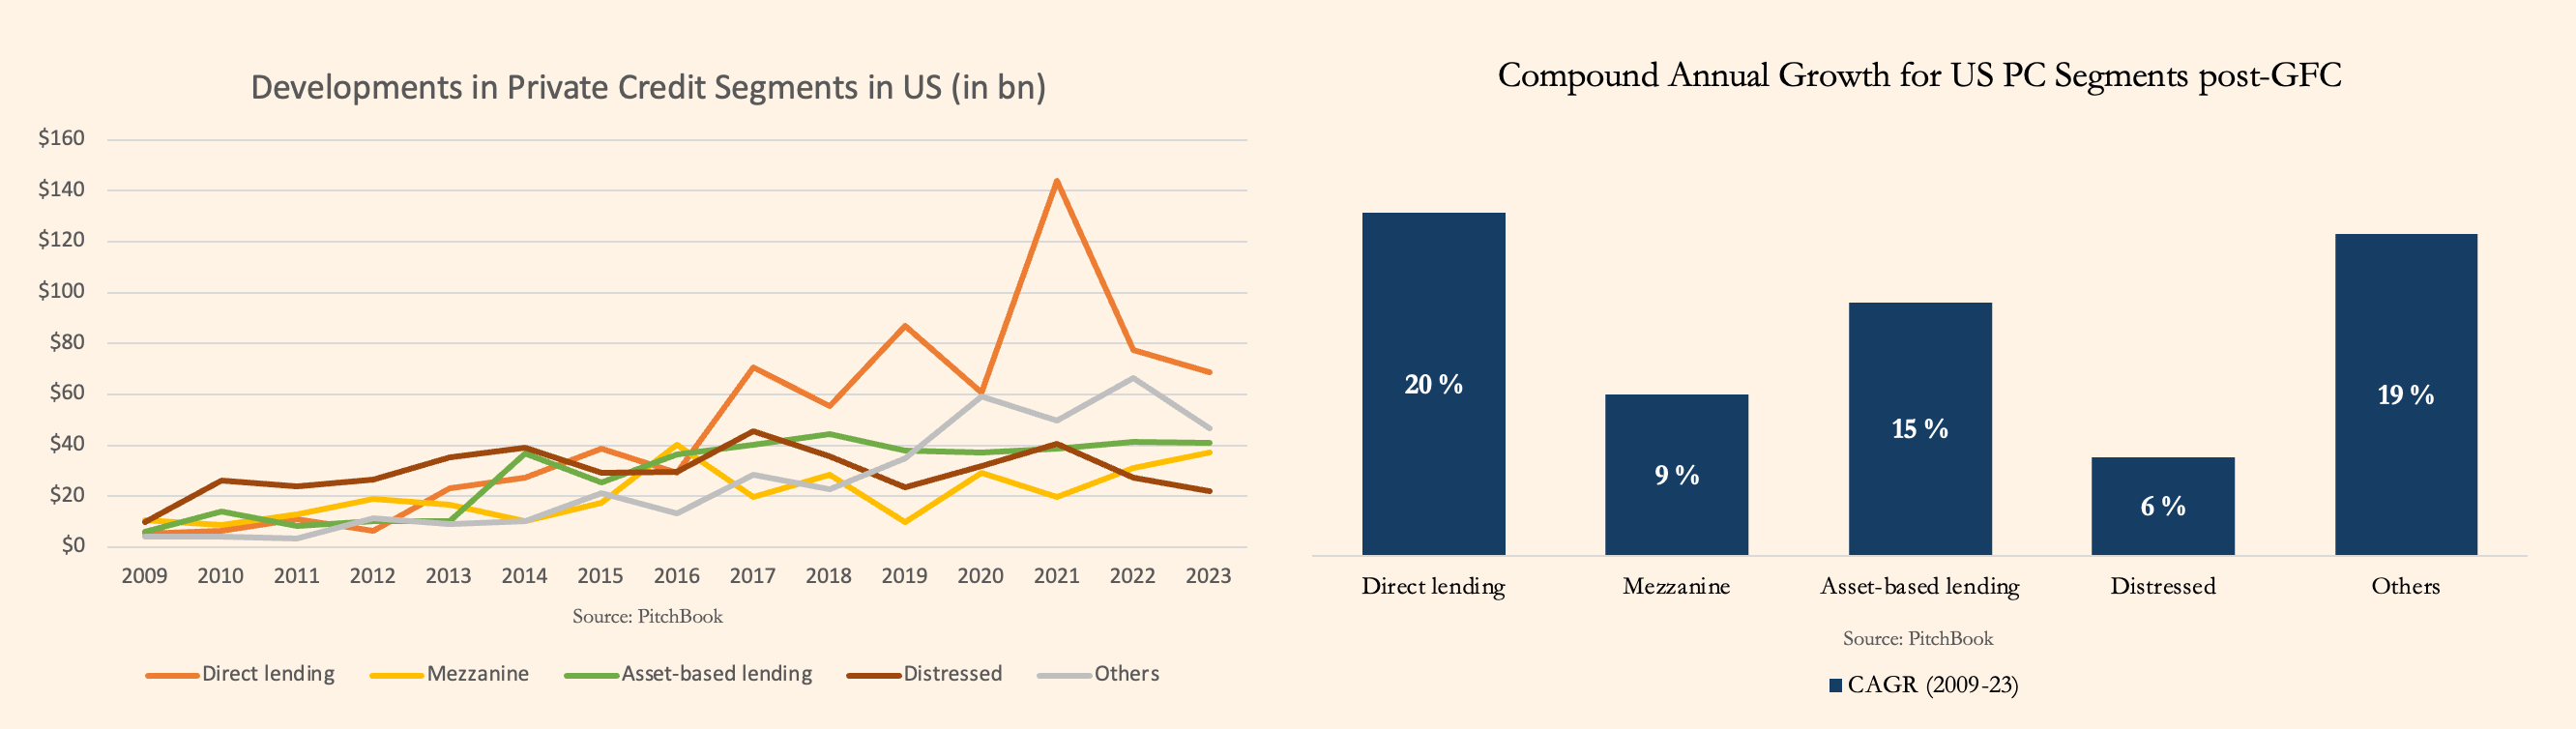
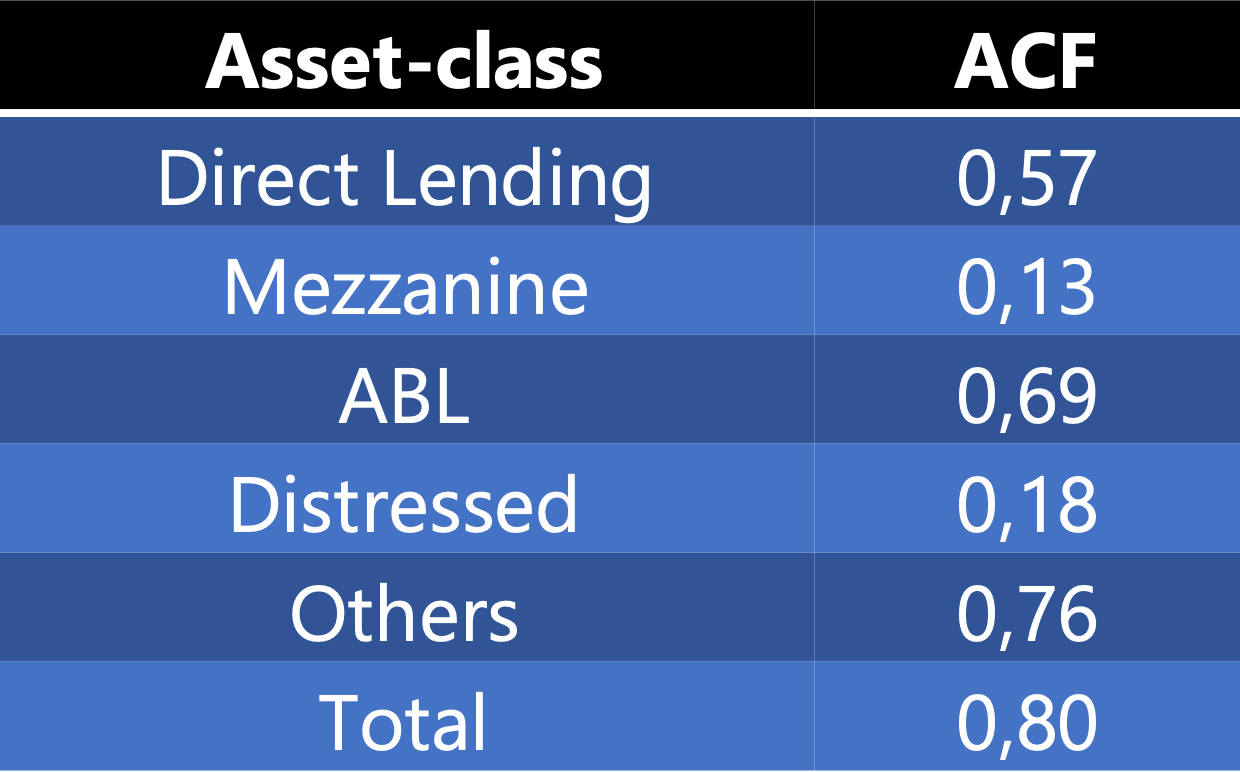
Growth of private credit has been prolific since the GFC. Direct lending asset class leading the charge seeing a highest spike during quantitative easing (QE), by fundraising US$205bn of inflows in our sample for USA. This sample has limitations, but it can illustrate what is otherwise reported by credible institutions, with few caveats, while we see decline in allocation for asset-classes in a period of quantitative tightening (QT) in US, overall deployment of capital continued to increase contributing to secular growth of PC. In total funds inflows we see autocorrelation (ACF) of 0.80 with one-period (year) lag, and ABL being the most persistent asset-class with highest positive ACF of 0.69 as can be guessed by its smoothest performance in the line chart. Relevant further details, to our previously mentioned AI infrastructure spending as International Financing Review (IFR) reports that already in 2025 ABS asset class issuance will break records backed by data centres and related infrastructure, suggesting a pick-up in ABF and ABL. Additionally reporting that AI infrastructure buildout will require US$7tn in next 10 years, enabling us to state with strong confidence that several asset-classes from PC will participate in financing of those deals specifically those that are asset-backed as mentioned previously. Deals for PC are starting to pick-up again with tailwinds from expanding opportunities, prefiltration into new geographies and monetary policy rate cuts. All this holds true if concerns about the infrastructure overbuild bubble don’t materialise.
Read more about bubble concerns from our article: Are We in the Next Bubble?
Risks
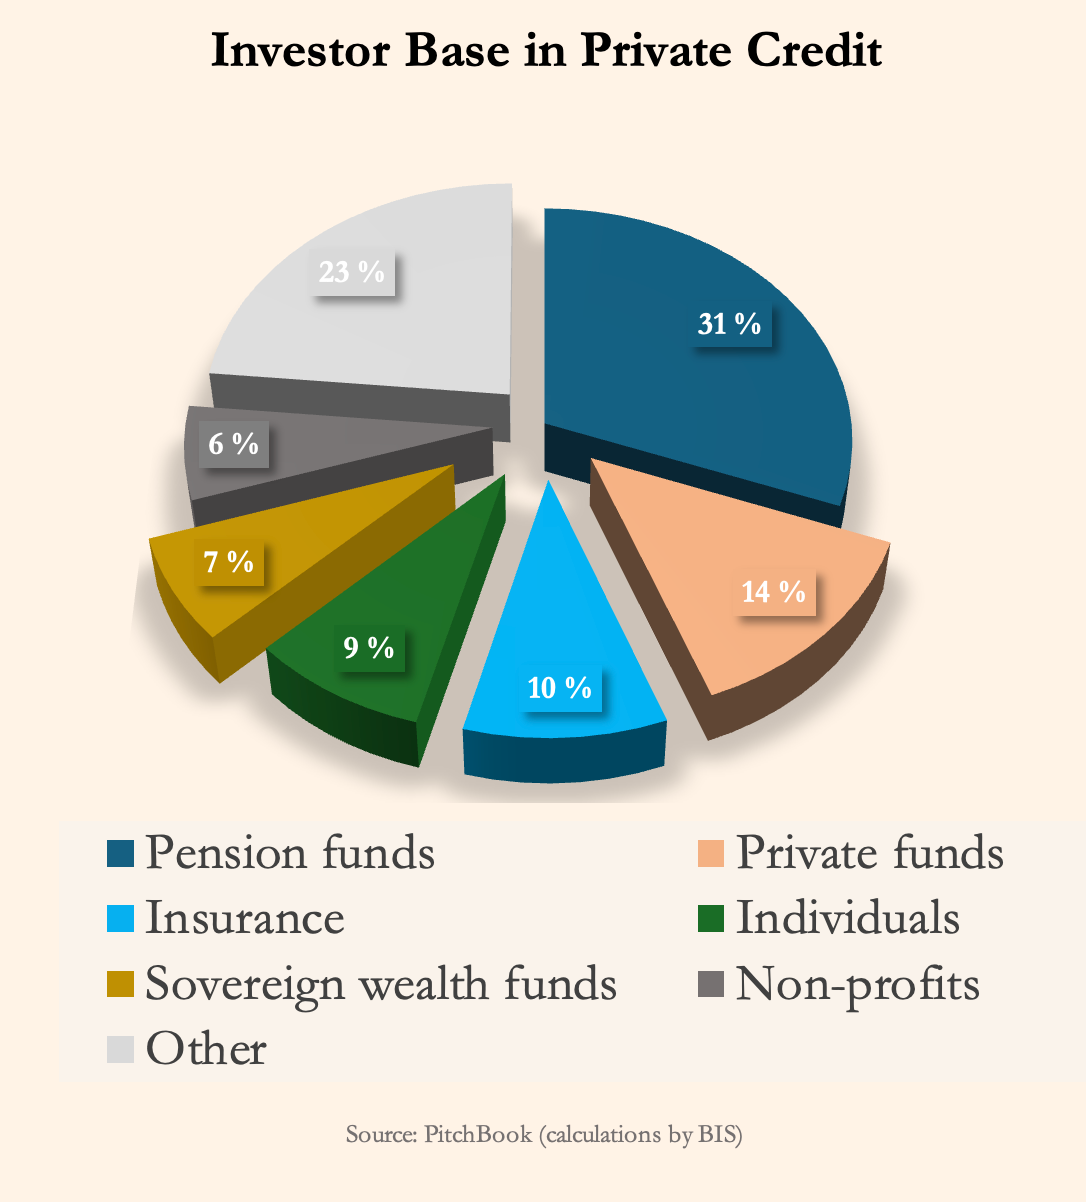
Investor base in PC is a diverse set of LPs, with pension funds allocating most to private credit funds in effect being largest source of capital commitments for these vehicles. While residual risks with this type-of-investing remains high, as the old proverb goes – the higher the risks the higher the returns – is not in itself worrying, if investors are not overexposed in their pro rata allocation to riskier assets. However, the problem lies elsewhere, namely with inherent risks’ lax mitigation, interconnectedness with traditional lenders and complex & opaque structures. For this section we consulted with analysis from two biggest credit rating agencies (CRAs) Moody’s and S&P Global, in addition to Federal Reserve’s capital assessment and stress testing results.
To explore further interconnectedness, that we began illustrating in the beginning of the article with the ‘flow of capital’ diagram, we’ll provide examples and traditional lenders’ lending volumes to PC funds, while simultaneously reviewing the credit ratings and default rates. All supported by Moody’s analysis giving us great insights into the nature of the risks.
There is increasing number of partnerships and joint ventures with traditional lenders. In addition to those named by Moody’s we found several others:
Between FGH Parent (insurer) and Carlyle with their Fortitude Carlyle Asia Reinsurance vehicle that has US$700mn of deployable capital, planning to expand its debt financing in Asia with potential to grow to US$10bn AUM.
Commitment from AIG (insurer) of US$2bn to Onex for PC & private equity (PE) investments and co-acquisition of Convex for US$7bn.
Athene (insurer) an Apollo with their joint plan to generate US$15bn in deployable capital.
Blue Owl capital with its Blue Owl Insurance Solutions integrating private market solutions for insurance industry.
And banks;
Citi and Apollo US$25bn PC direct lending partnership.
Wells Fargo and Centerbridge Partners with their joint venture Overland Advantage that has already deployed US$5bn in PC loans.
Barclays and AGL with US$1bn private credit platform.
Otherwise think of almost any bank, and they will have some loan exposure to PC intermediaries.
These partnerships and joint ventures can be worded in a number of ways, but the bottom-line is that interconnectedness with traditional lenders is expanding in private credit in several ways, having the potential to amplify the associated risks. Mitigation of inherent risk with covenants is weakened by introduction of covenant-light (cov-lite) loans i.e., financial maintenance covenants are increasingly substituted with incurrence covenants – rather than meeting ongoing financial performance tests periodically, the barrower is tested only on seeking to carrying out an action such as planning to incur a new debt. There is more nuance to cov-lite, but for our purposes, lets simply state that barrower has less restrictions and penalties associated with servicing their debt with cov-lite and looser covenant practices in general, having more flexibility in their actions.
Moody’s point out about sponsor-backed deals having this trend, if we take AIG as example then Onex might finance Convex with cov-lite loan transaction on top of the existing exposure, amplifying risk and transitivity of it in their three-way relationship – in effect further increasing concentrated affiliated exposure.
Less hypothetical example illustrating some of the complexity in dealmaking, would be with Athene and Apollo, holding minority investments in Athora (insurer) that is expected to acquired Pension Insurance Corporation (UK insurer) for £5.7bn in early 2026 – Athora in related press release, listed among benefits to UK insurer an ‘enhanced asset origination capabilities, including in private investment grade credit resulting from Athora’s strategic relationship with Apollo’. These three insurance entities hold between them insurance policies for 3.734mn people, among policyholders are retiree-annuity receivers. Additionally, Apollo has made US$4bn in private placements available to AT&T subsidiaries, now Athene provides annuities to 100,000 retirees of AT&T that it had moved off their employee pension plan, this is not to be taken as to mean that retirees now hold a frankpledge to second-order risks associated with PC investments – Moody’s and Fitch both rate insurance financial strength (IFR) of Athene as high quality (A1 and A+ respectively) noting hight level of expertise in managing complex assets – yet in risk considerations it is worth remembering that Athene’s portfolio is more exposed through private credit to market volatility than broader life insurance industry.
PIK allowances in debt investments are problematic as well, expanding the loan balance accruing non-cash interest, representing significantly higher credit risk, and increasing incrementally a probability of non-accrual on debt investment or significant fair value reduction of such an investment.
S&P Global is reporting that PIK interest is on average 10% of gross investment income for business development companies (BDCs).
While BDCs may be, or may not be publicly traded, they’re publicly reporting entities providing a window into private credit. Before we open that window and view the numbers, brief introduction on BDCs:
>70% of investments are required to be into public or private entities with <US$250mn valuation to be eligible for the portfolio. Redistribution has to be 90% of income as e.g. dividends.
Can be an access point for retail investor looking to invest in private credit.
Come in 3 types;
Closed-end private placement (institutional investors) with lock-up period and term-limit
Publicly traded on exchanges as any other public company (available to everyone)
Evergreen or perpetual where investor may participate with monthly entry and quarterly exists (typical withdrawals max. 5%)
Continuing with our discussion on risks, let’s look through that window.
For clarity on what is defined as IG and what as SG, S&P Global broadly defines AAA to BBB as investment grade, anything below that is a speculative grade (SG). Therefore, we’re mostly talking about non-investment grade with PC, speculative grade credit, although IG PC exists and is in vogue at the moment – either by classic private placement offered to qualified institutional buyers (QIBs) or exceedingly via ‘reverse’ JV where-to judicial entity (barrower) contributes assets (select assets or business units) and sells a minority interest to a buyer (lender) who is financing that equity stake with private credit secured by the assets of the joint venture.
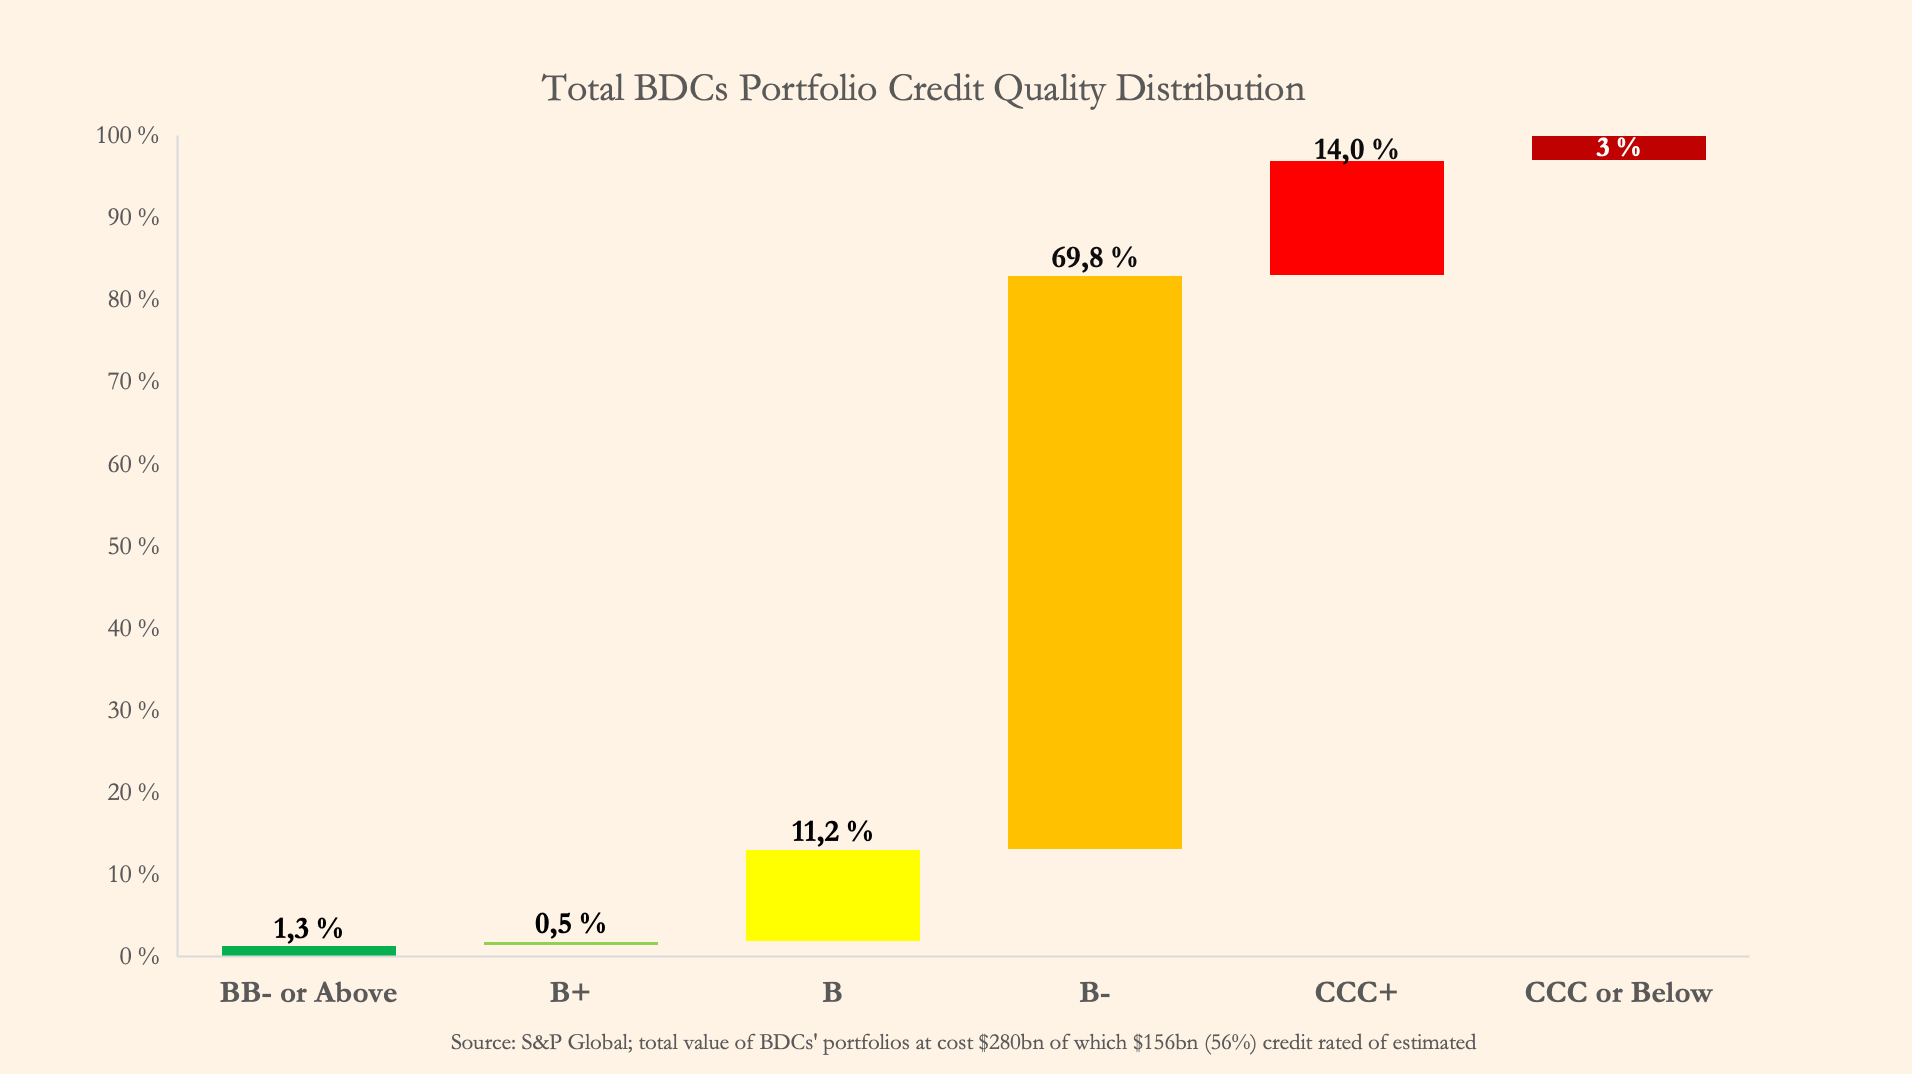
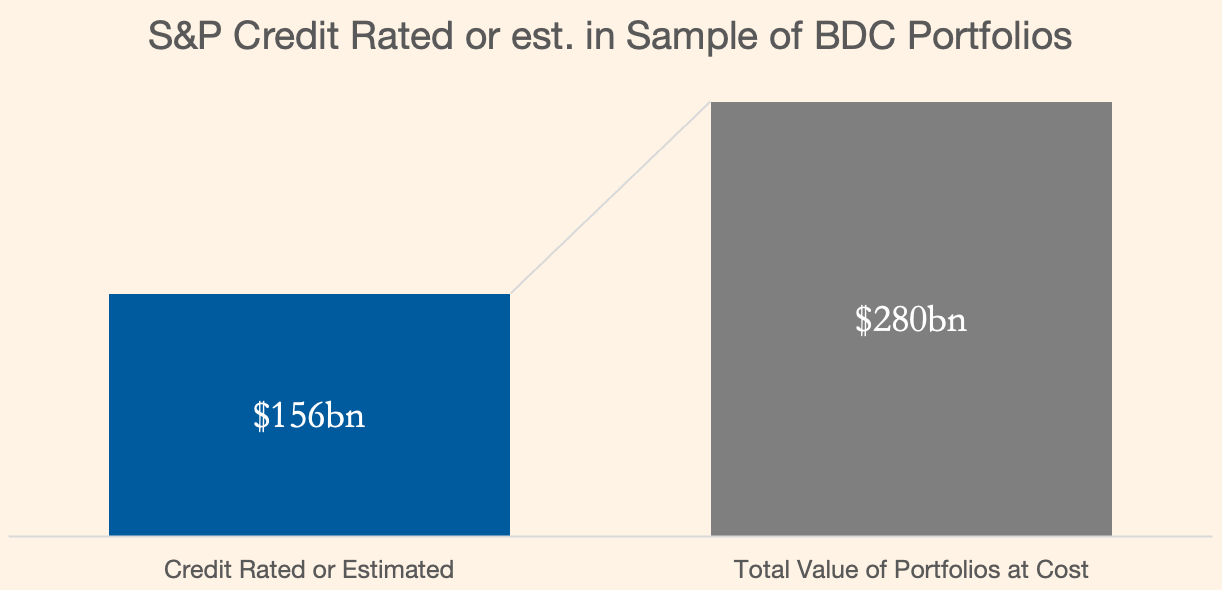
We can see that almost none of the credit ratings or estimates for 56%, on dollar-weighted basis, of a sample of predominantly credit related BDCs’ portfolios, are rated investment grade. The biggest proportion being high-yield between B+ to CCC+, while distressed component below CCC is quite small.
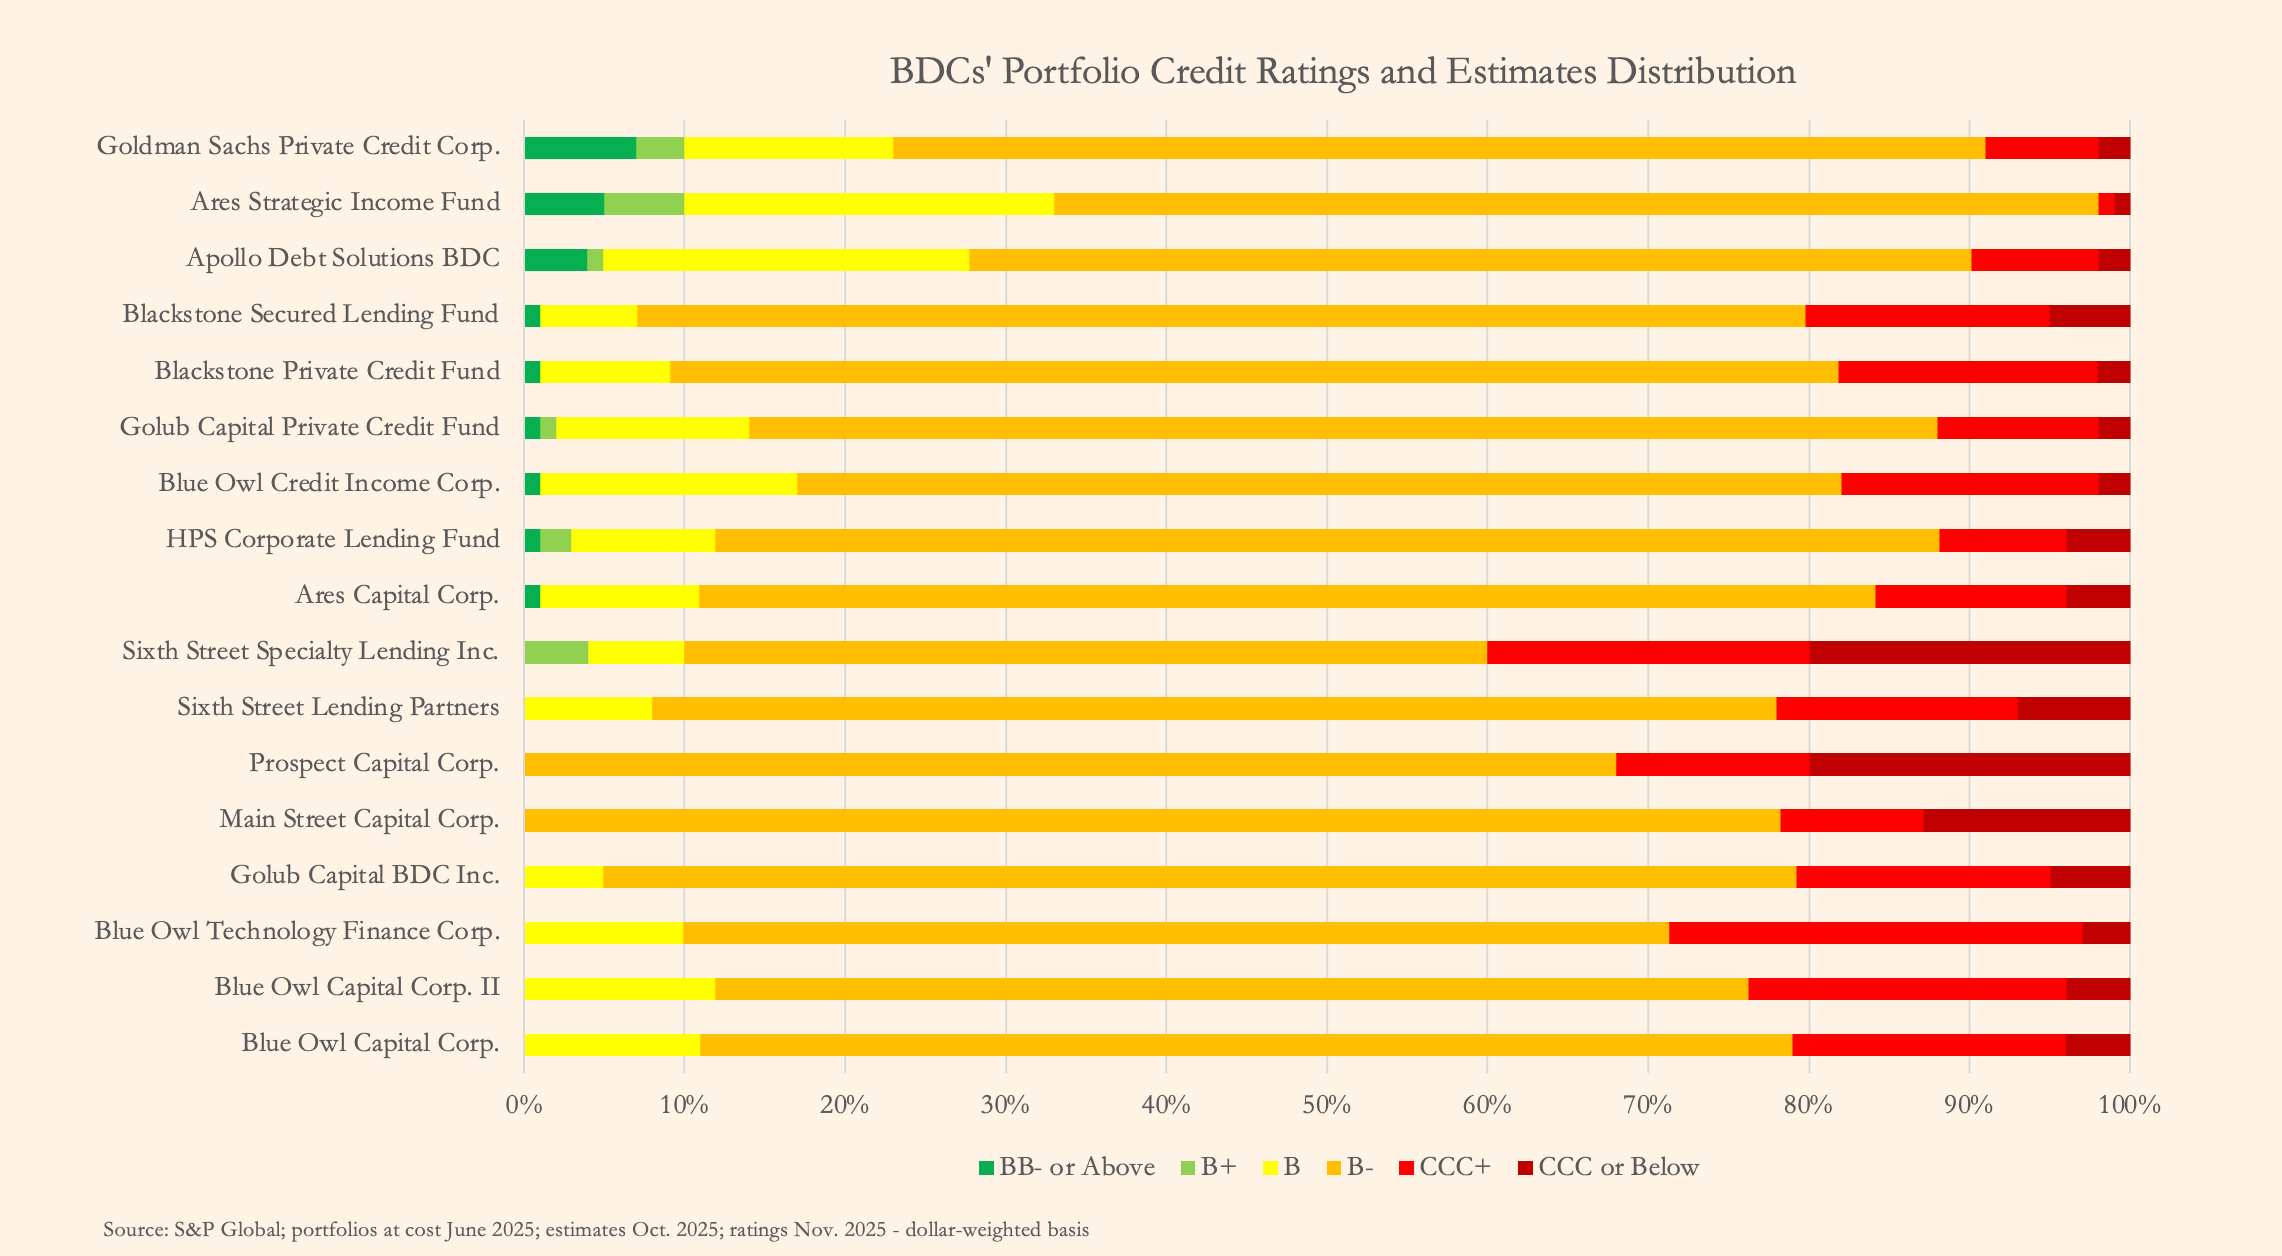
If we look closer it’s nothing to write home about, with B- capturing 70% of the portfolios’ total and 95% between B–CCC+, but neither unexpected for such high premium investments. So, let’s define associated credit ratings, with B, obligor currently has capacity to meet financial obligations, but vulnerable to adverse economic conditions. CCC, currently vulnerable, depended on favourable economic conditions to meet its obligations. This very much sounds like – all good till we hit a recession, when these debt portfolio companies will be tested, alongside the quality of underwriting and contractual covenants made by asset managers.
This should be not misconstrued as advocating against private credit, we have a positive stance towards PC, but risks should not be neglected or ignored irrespective of sentiment. Gladly we’re not alone concerned, as MSCI and Moody’s launched risk assessment tool for PC investments, namely integrating MSCI’s private capital data into EDF-X platform. EDF-X is a proven concept, early warning system (EWS) was triggered, as it should, early for First Brands when probability of default (PD) exceeded the threshold, months in advance of the bankruptcy.
If you’re discouraged, then let’s add some perspective, Renault had BB+ credit rating i.e. speculative grade, for past five years, only now turning the corner, does that mean one shouldn’t provide a line of credit to them while understanding all the risks? PC counterpart would be Jane Street Group (BB+), into which Blackstone Private Credit Fund made a first-lien cumulative US$6mn debt investments with SOFR+2%. On balance, it’s not all so rosy, same fund has several debt investments into Curia Global (CCC+), company that was reportedly struggling to generate FCF and having some of loans recovery rated 3 by S&P Global, to illustrate we isolate one ‘pure’ PIK US$50mn second-lien debt with 15% interest, already estimated to be at fair value US$5mn below par. Then there is concentrated exposure between funds, as with Crewline Buyer, Blackstone affiliated fund deployed US$123mn and Blue Owl Capital Corp. US$148mn, both SOFR+6.75% first lien.
Using Moody’s annual default study published in Feb 2025, for this sample we computed 1-year default rate of 3.42%.
S&P Global further provides figures for collateral of PC CLOs saying ‘vast majority’ are B-. For estimates completed in the trailing twelve months 8% are B+–B, 75% were B- and 16% CCC or below.
Then there is so called private letter ratings (PLRs), popular in US, which are not publicly disclosed contributing to the opacity and rendering assessment of creditworthiness of underlying assets difficult. In EU, PLRs are not explicitly prohibited, but due to regulation made useless, however BIS writes about internal credit ratings used by insurers, likewise not disclosed, and which beyond model utilised are not supervised. That said, credit ratings are not absolute and capital allocation to various funds should be done by an investors able to access information about financial positions of underlying constituents in the given fund’s portfolio, understanding terms & debt structure implications, subsequently performing risk assessment with enhanced visibility by using e.g. MSCI & Moody’s solution for fund’s expected loss (EL) computations, i.e. exposure at default (EAD), probability of default (PD) and loss given default (LGD).
Conversely, we have seen in a presentation for MSCI & Moody’s PC credit assessment tool quoted Ba dominance in direct lending, making it ‘private credit investment grade’, or rather lower investment grade, meaning rated in the range of BB+–BB- converting to S&P credit ratings system. This supports Marc Rowan’s statement that in reality ‘most private credit is investment grade’. On the other hand Jamie Dimon puts this in perspective – ‘but if you look at like CLOs and lending to leveraged entities that are underwritten with leveraged loans, so there’s kind of a little bit of double leverage in there, I would say that, yes, there will be additional risk in that category that we will see when we have a downturn’, in essence we’re talking about leverage-on-leverage that is associated with sponsor-backed direct lending and derivative nature of CLOs.
Turning to contagion risk, let’s take a look at AUM composition of PC credit funds.
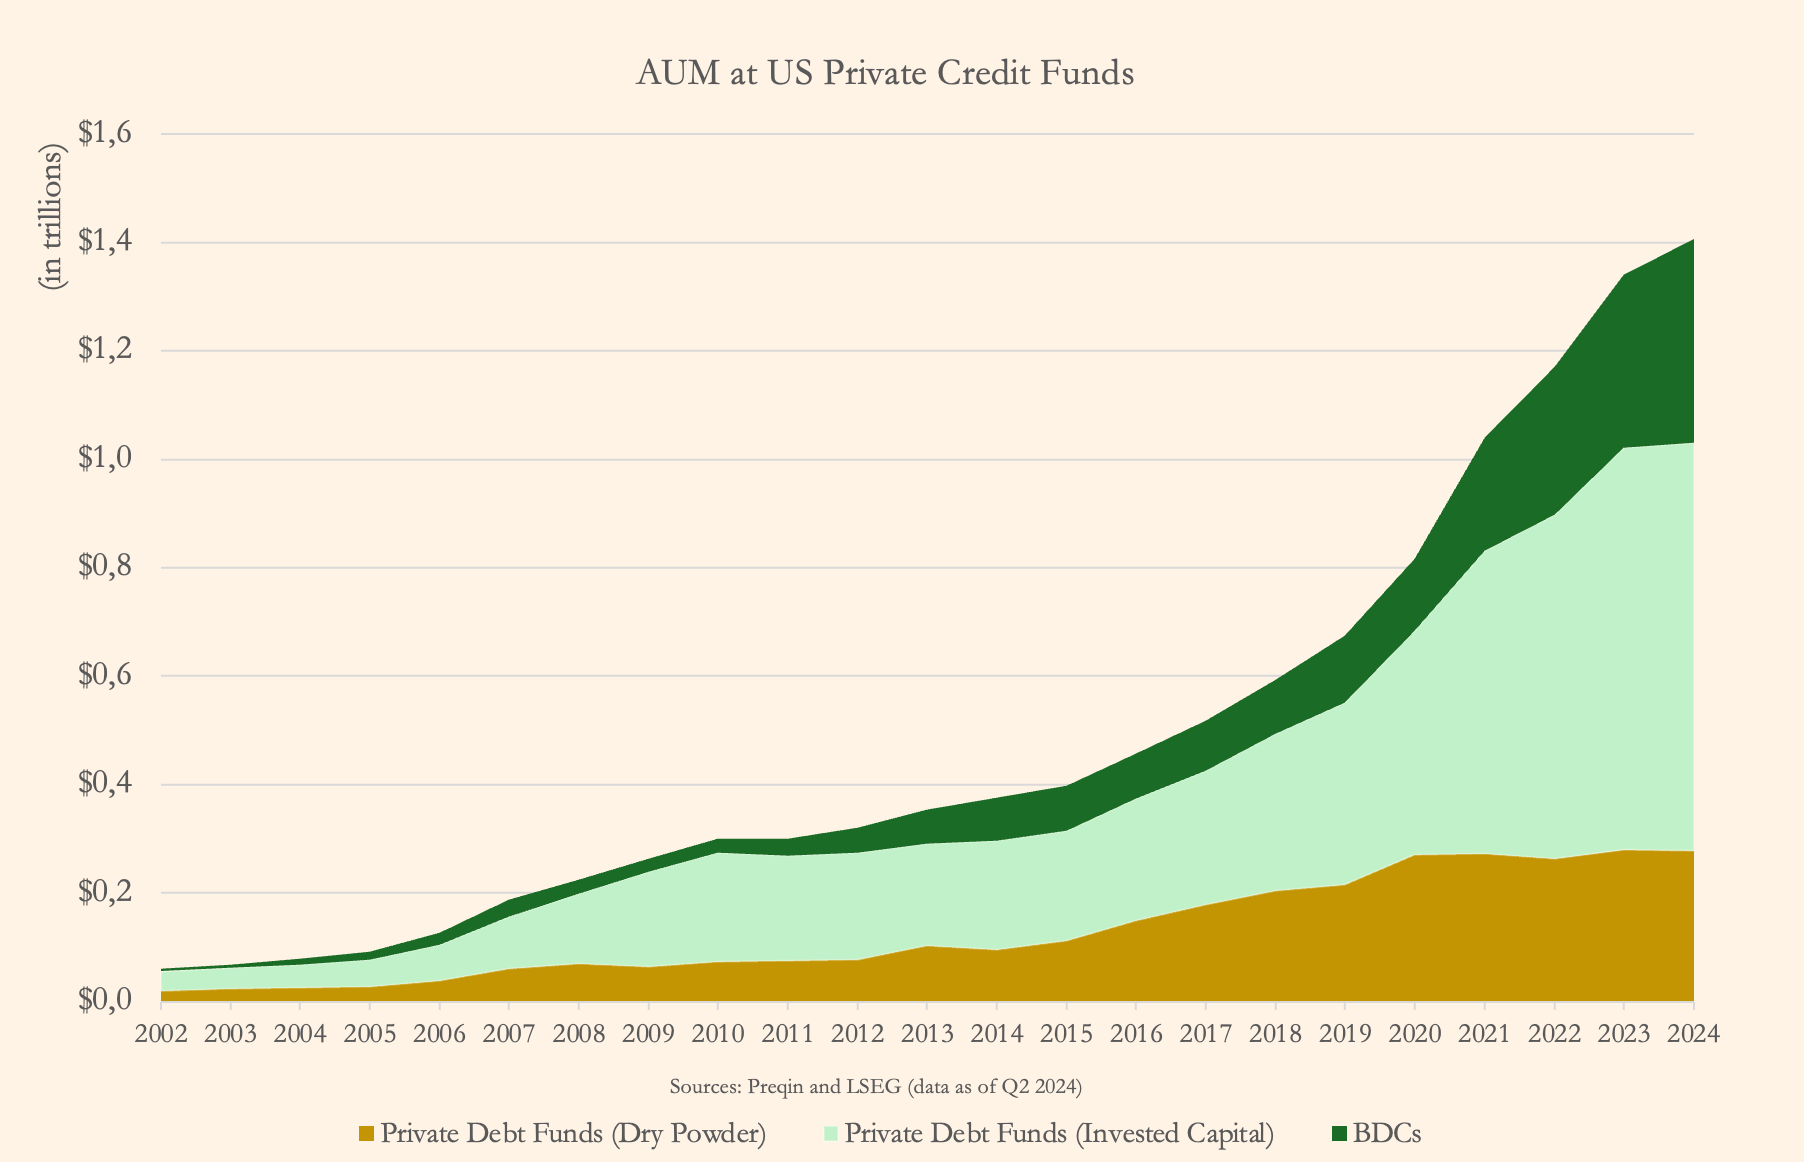
Assets under management for private credit vehicles are secularly growing. Gilded bedrock in this chart represents ‘dry powder’ of undeployed accessible capital, which in turn is based on the capital commitments from LPs as they made fund subscriptions, and as we remember from the beginning of the article, capital call facilities (subscription-lines) are also extended by traditional lenders based on unused, or if you will, uncalled capital commitments.
This US$280bn’ worth of ‘dry powder’ is not only relevant for peace of mind of subscribed investors, knowing that is not free-for-all origination spree, but that funds they subscribed to, are able to deploy substantial amount of capital (incl. theirs) as advantageous opportunities for investments arise, even, as it was, during tightening monetary policy environment. Conversely, this is perhaps truer in context of PE, since to a degree ‘dry powder’ chasing deals led to lax treatment of covenants. But that’s beside the point, here we’re interested in banks’ revolving credit facilities relative to ‘dry powder’, and other bank lending exposure to PC entities.
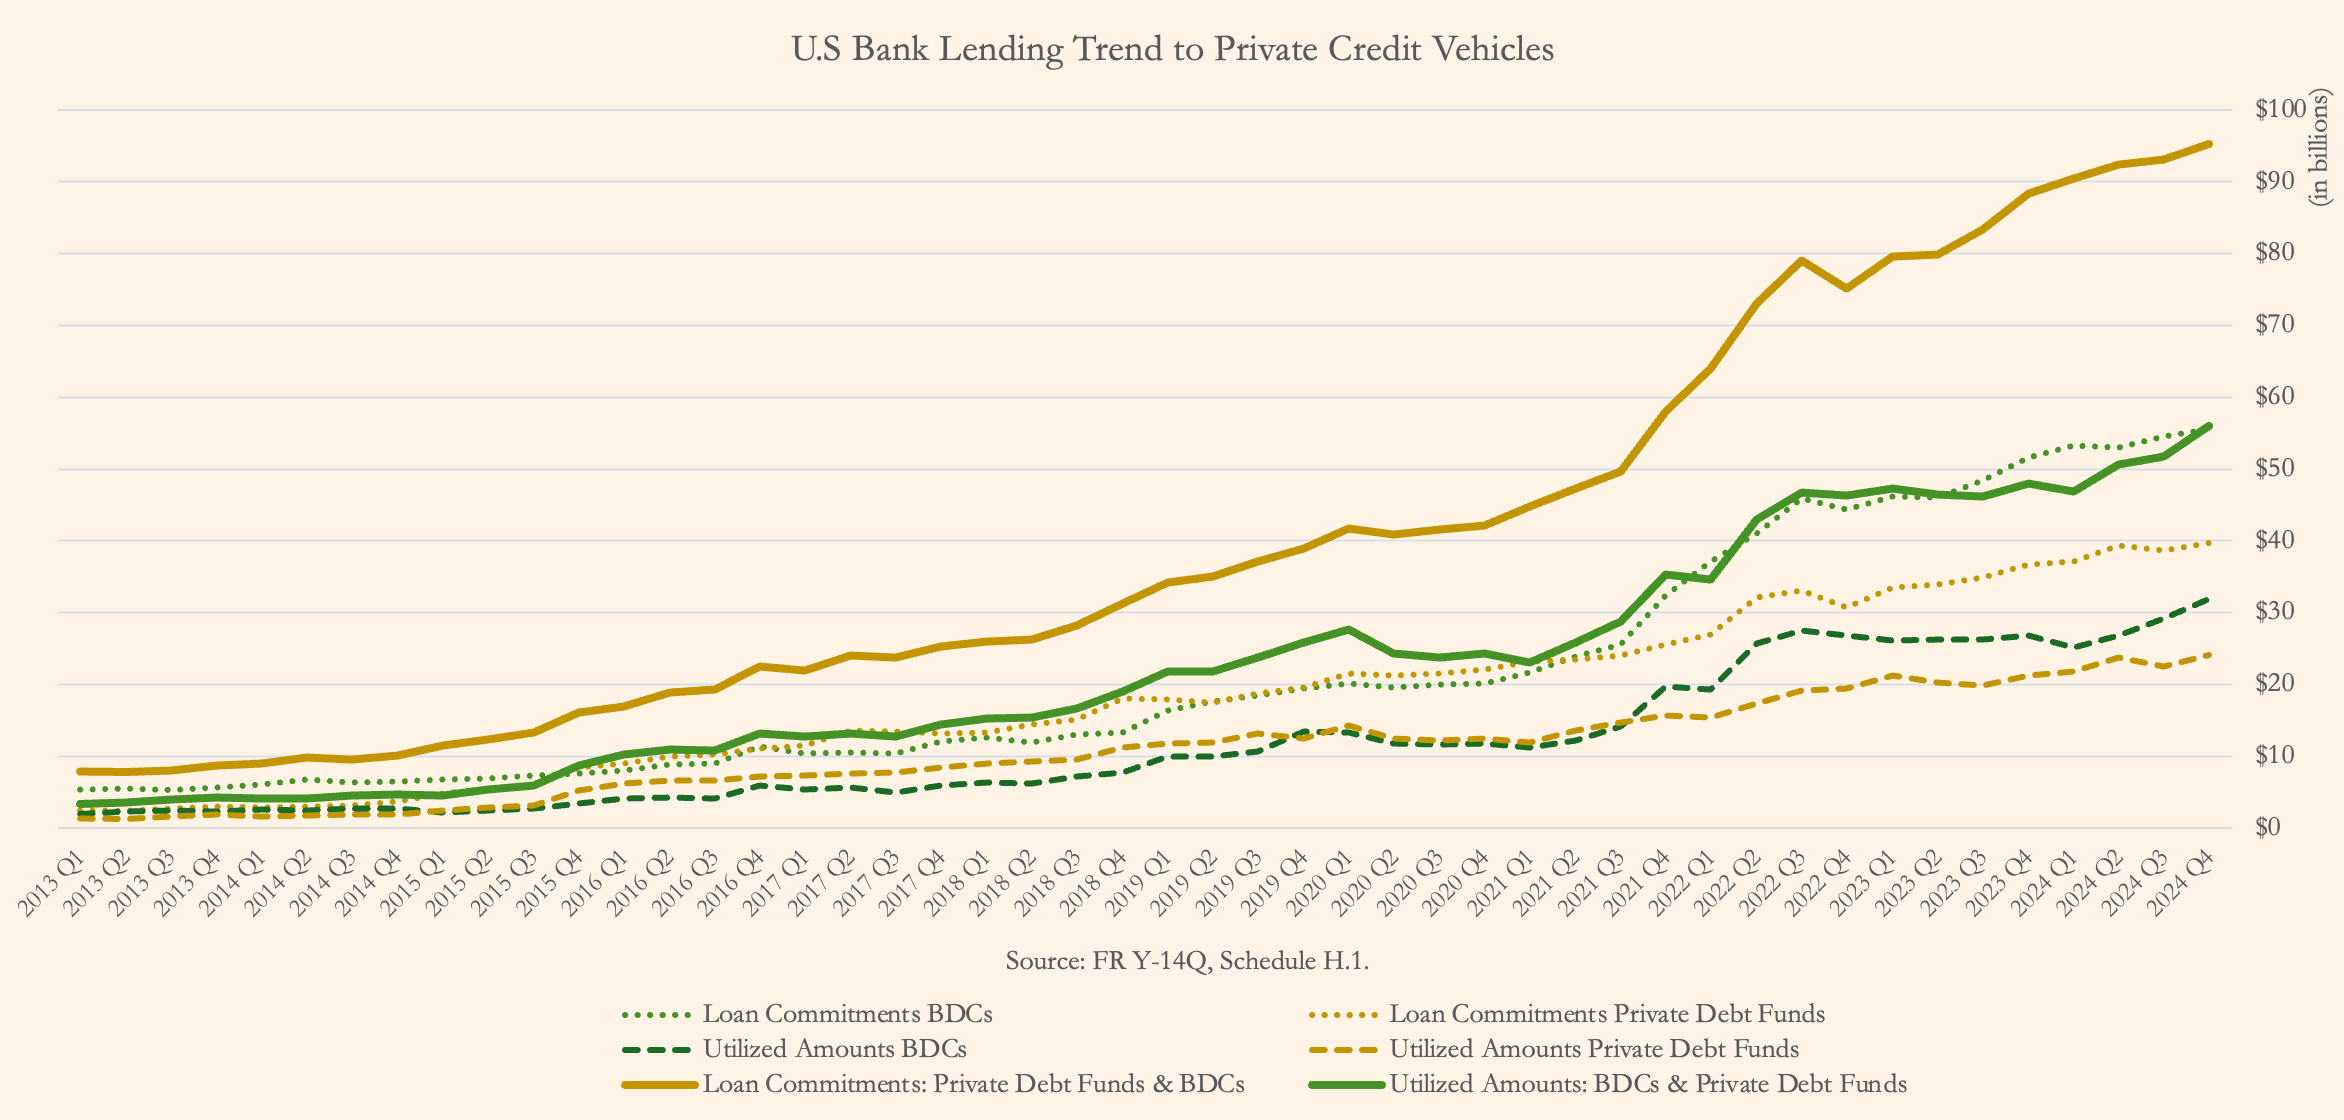
According to the Federal Reserve total commitments by banks to private credit vehicles in U.S. were just shy of US$100bn at the end of 2024, of which 59% (US$56bn) were drawn from available facilities by the market participants, these facilities are predominantly revolving credit facilities (US$79bn) standing at 56% utilised. This leaves us with undrawn amount of US39bn for BDCs and other PC funds, or US$24bn and US$16bn respectively, pardon, we rounded-up a wee bit.
Since Q1 2013 bank exposure in lending to private credit funds grew by 1120% with annual growth rate of 24%, only in past 5 years decelerating to 20%, while loan utilisation during this 11-plus year-period grew by 1570% outpacing the commitments with annual growth rate of 27% suggesting that deployment of capital has been robust.
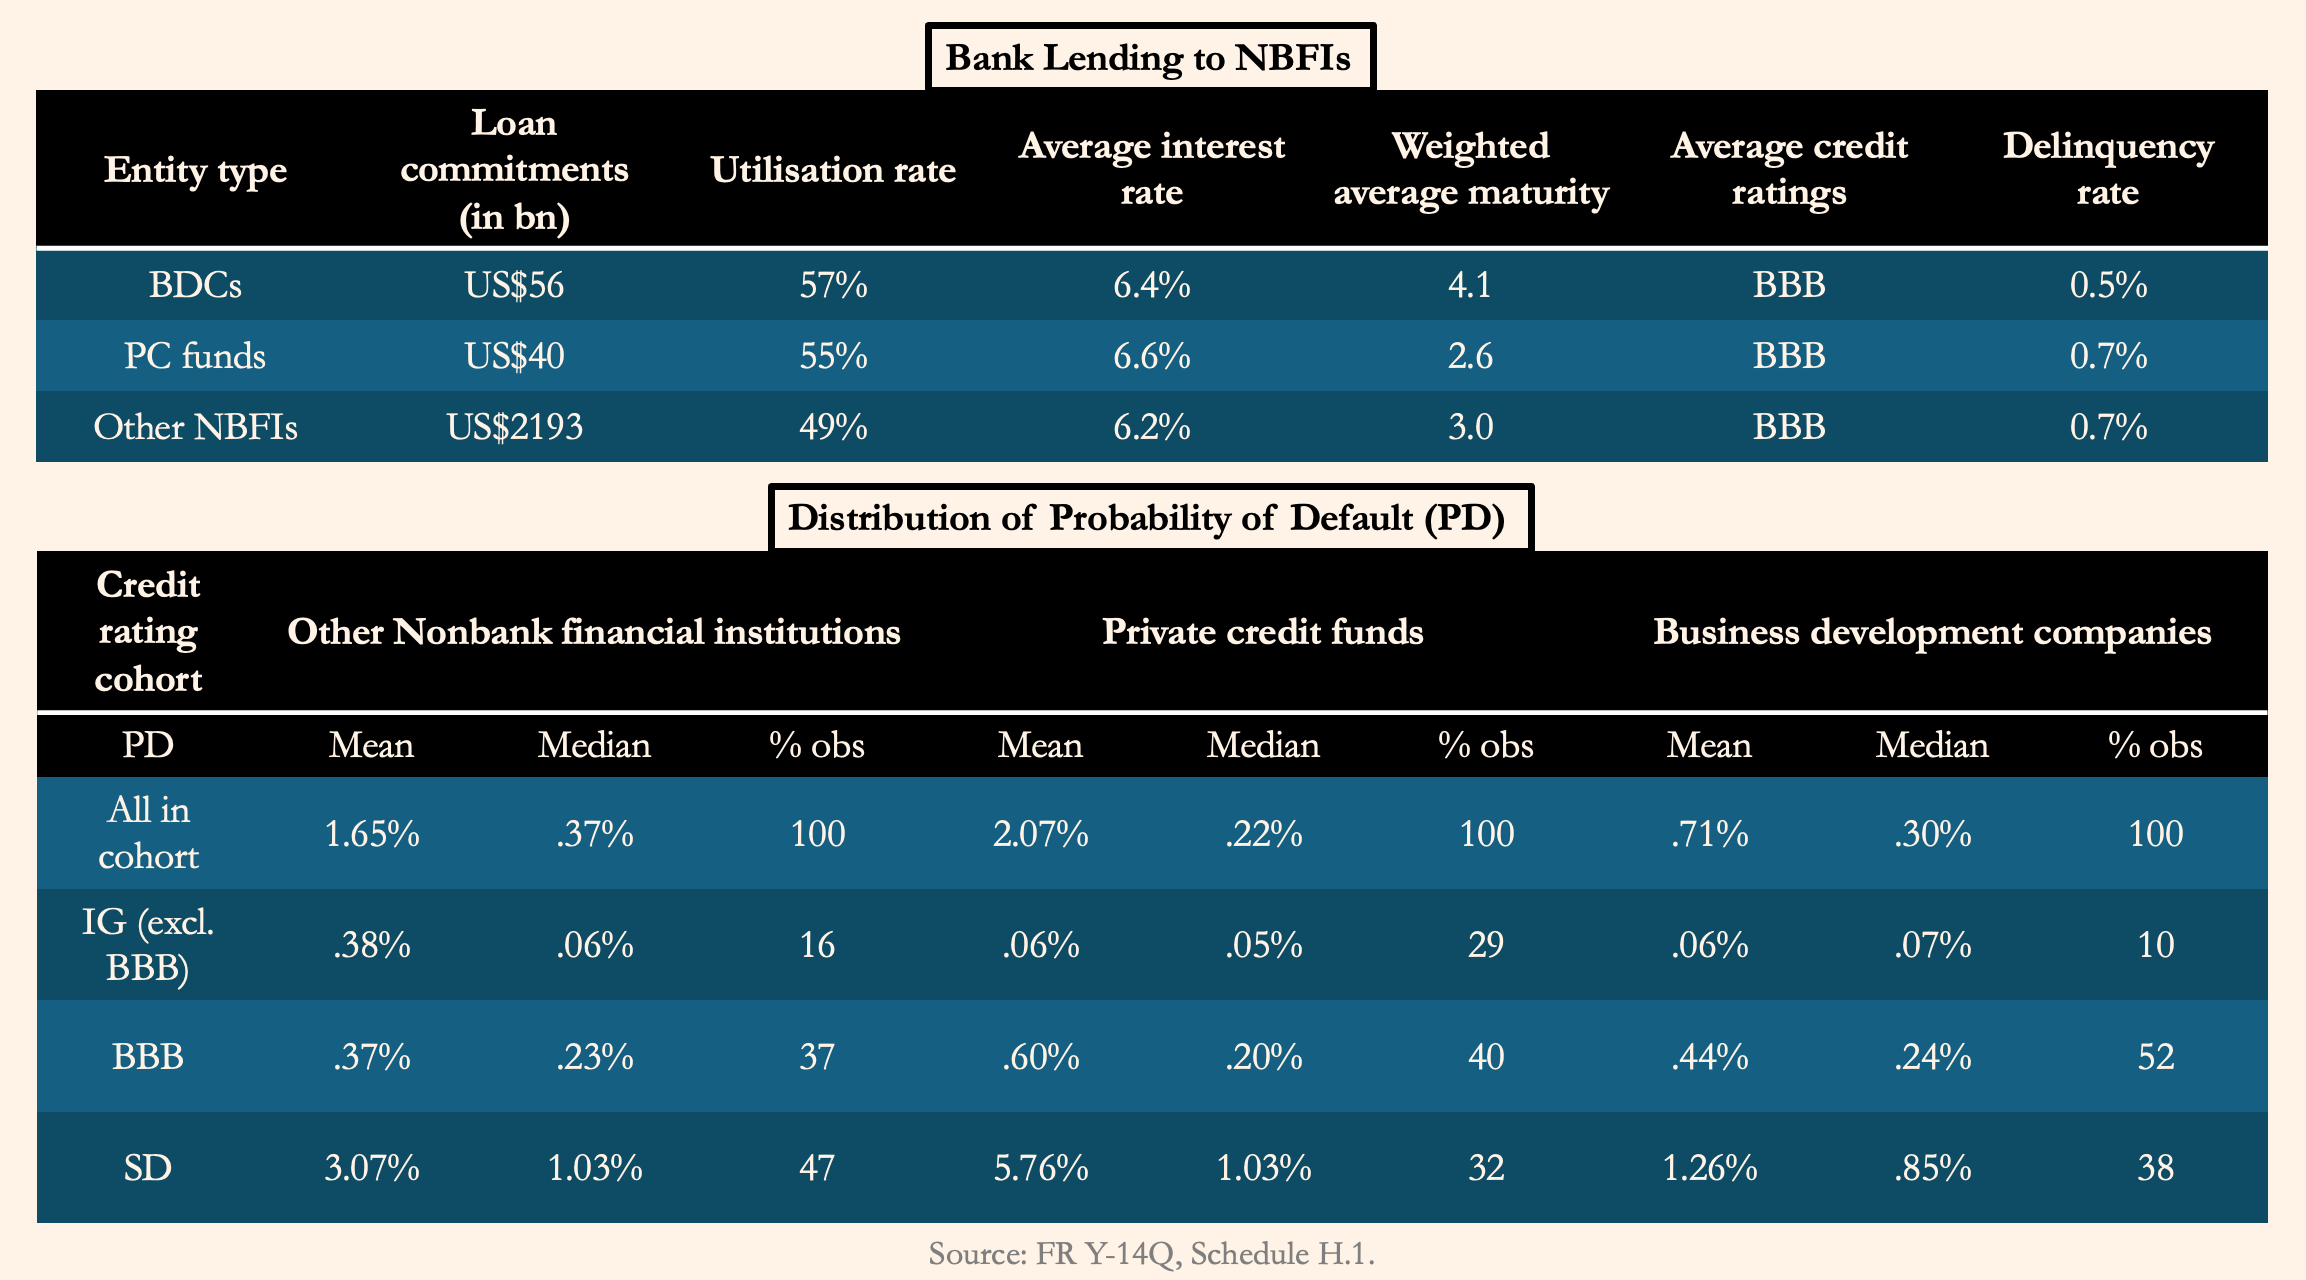
Amid the context of enormous size of the private market, however, the private credit markets remain relatively small in comparison, in bank lending and otherwise. Namely, in comparison to US$2.2tn of loan commitments by banks to NBFIs, this cohort of other than private credit vehicles grew in the past five years by 53% vs. 144% for private credit vehicles, with BDCs leading the charge standing at 186% and private debt funds at 103% for the period. This fast-paced sectorial growth raised concerns and earn closer attention from regulators, as estimated 60% of the exposure is concentrated at 5 U.S. global systemically important banks* (G-SIBs). Largest borrowers are asset managers from Ares, Blackstone and KKR affiliates.
*For an interactive G-SIBs dashboard we suggest visiting Q-SIBs Dashboard
However, as always, context matters, PC & BDC entities have high proportion of IG credit ratings, i.e. for roughly two-thirds of these entities the probabilities of default as well as payment delinquencies are very low. It is relevant to note that banks’ lending exposure to other NBFIs is manifold greater, although that cohort is evenly split between SD and IG credit rated constituents. BDCs are dominant segment in the share of bank commitments (60%) in our sample, Federal Reserve estimates that total credit commitments by other NBFIs and traditional lenders to BDC sector stands at US$87bn. On both average and median PD basis BDCs are faring better than other NBFIs, and generally are higher performing obligors being more efficient in servicing their obligations with lower levels of payment delinquencies compared to the rest of the population in sample. Private credit funds in the speculative grade cohort have higher PD on average, but substantially lower median is telling, suggesting that perhaps a smaller number of weaker performers, as outliers, on the lower end of credit-quality spectrum are pushing the average higher.
That doesn’t counteract the effects of higher levels of leverage, however, in the private credit sector and the risk amplifying implications of transitivity of contagion risks, that said, after reading several reports we don’t see any panicky emergence of systemic stress, so sleep tight.
Therefore, primary risk to banks from regulators perspective, in this context, is that under financial stress scenario there would be substantial drawdowns in revolving credit facilities by private investment vehicles. Stress test show that even in hypothetical scenario, during which utilisation rate would increase by 44 percentage points constituting a holistic drawdown of US$36bn, the banks have sufficient capital reserves and liquidity to absorb potential drawdown risk. In this scenario liquidity coverage ratio (LCR) and CET1 capital would be effect by lowering 1pp and decreasing 2bps respectively. Subsequent analysis was conducted to incorporate the PE firms, and the results were as satisfactory, producing only minor discrepancy in results. We’re reminded that LCR requirements state that banking institutions shall hold 40% of undrawn credit facilities amounts in high-quality liquid assets (HQLA), crudely in cash and equivalents.
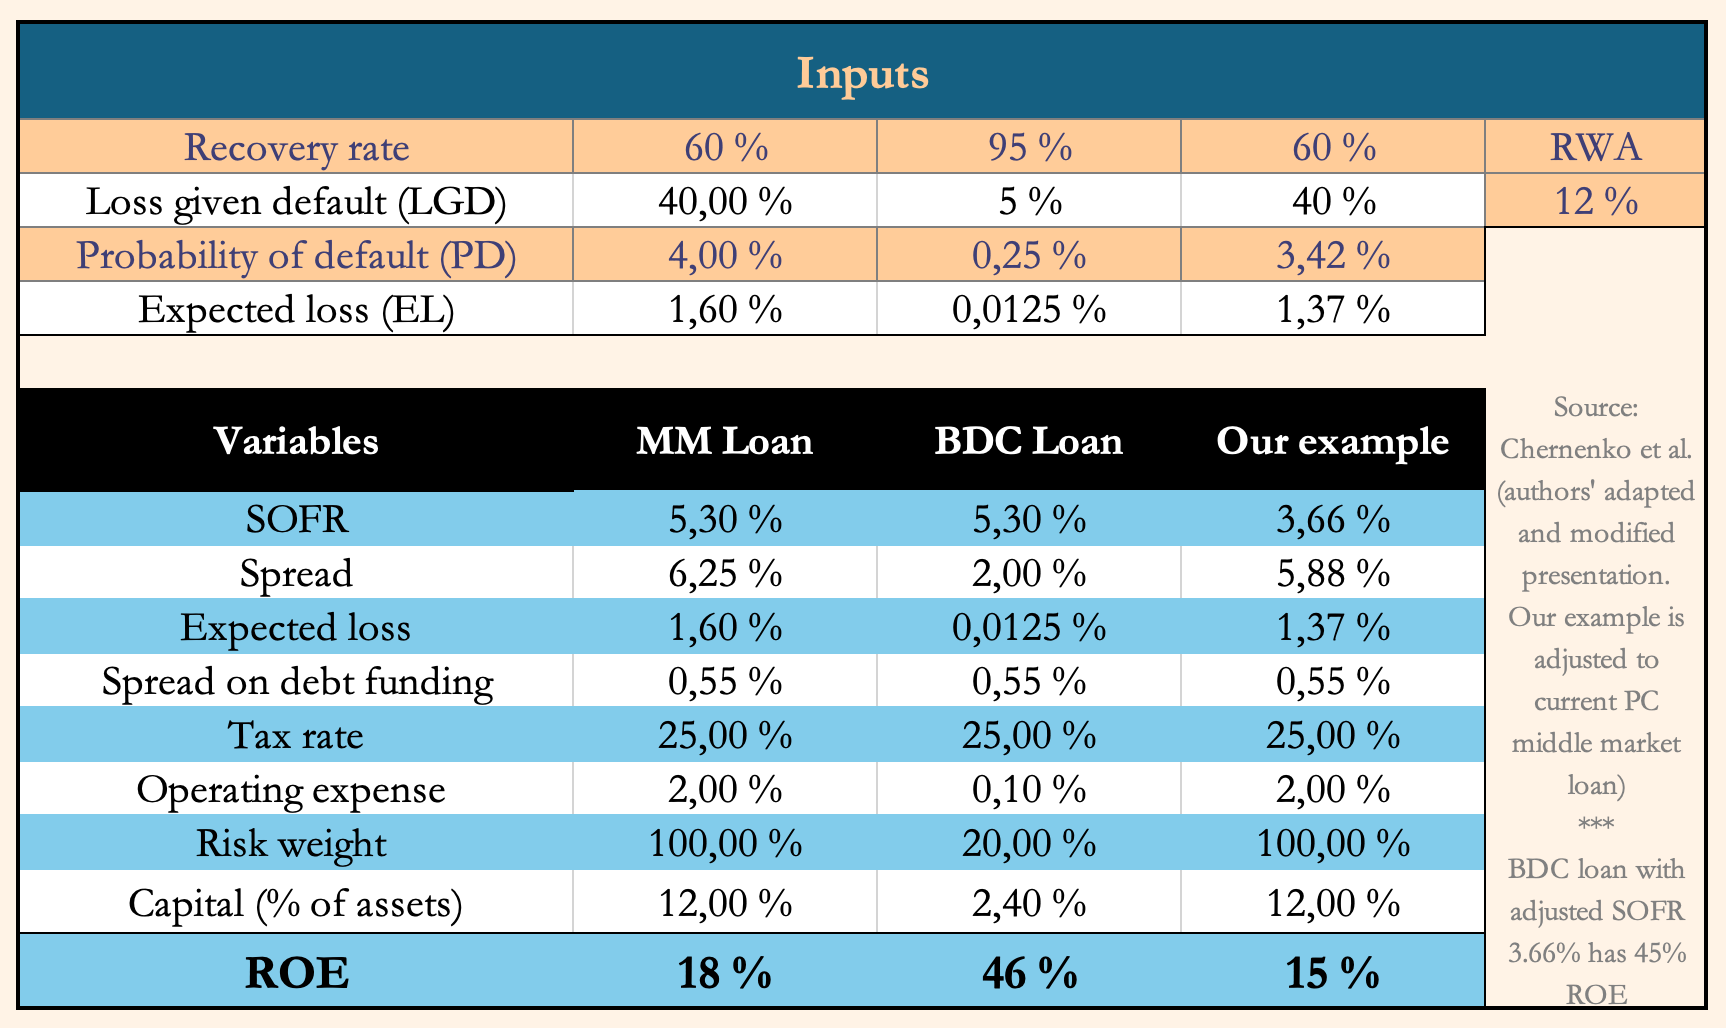
Based on insightful working paper (Chernenko et la.) we have learned that banks’ lending to BDCs, as opposed to directly lending to middle market entities, is substantially more lucrative enabling banks to earn excess returns. Learned researchers also considered 20% risk-weight implications for CET1 ratio, testing the assumptions with higher capital requirement, 5% of supplemental leverage ratio* by raising (equity capital) capital holdings to 5% of loan assets, which held true the outperformance of return on equity (ROE) at 25%. Furthermore, researchers suggest that ROE exceeds RRR (required rate of return) even given higher levels of leverage ratio in the BDC sector.
*Supplemental leverage ratio is 3% for banking institutions subject to capital requirement, but enhanced supplemental leverage ratio with a two percent buffer is require for Q-SIBs.
Returns
While there is some debate about whether private credit risk-adjusted returns are indeed higher than other traditional lending, or comparable debt instruments, e.g. high-yield bonds, leveraged loans and BSL. Total returns are indeed historically higher; there is several reports by market participants on aggregated or annualised total returns outpacing other debt instruments. We found a solid working paper* (Erel et al.) evaluating cash flows to investors, arguing that net of fees risk-adjusted returns accounting for equity factor together with debt factor are not producing higher returns and do not generate alpha against their benchmark, i.e. neutral. However, several assumptions are made for risk-adjusted profit computation, and these results are depended on including equity factor (using debt factor exclusively generated outperformance of 1.8% alpha p.a.), as well as taking the investors perspective on the cash flows. They find that with gross returns (incl. fees) even discounting with both equity and debt factors the returns are significantly positive with implied alpha of 4.1%, but these ‘rents’ go predominantly to deployers of the capital GPs, not the invested LPs.
*Please keep in mind that this is a working paper produced for discussion purposes, as this article, and not peer reviewed. That said, this paper is produced by learned finance researchers from credible institutions, all of them published by top-tier finance journals.
In reports we’ve seen there is abundance of indices or spreads comparisons declaring that PC yielded higher returns than any other debt instrument, consequently we didn’t want to go the same route and produce another analysis that is readily available. Instead, we wanted to look closer at the components of private credit spread relative to risk-free and understand what affects will the floating rate have on total returns.
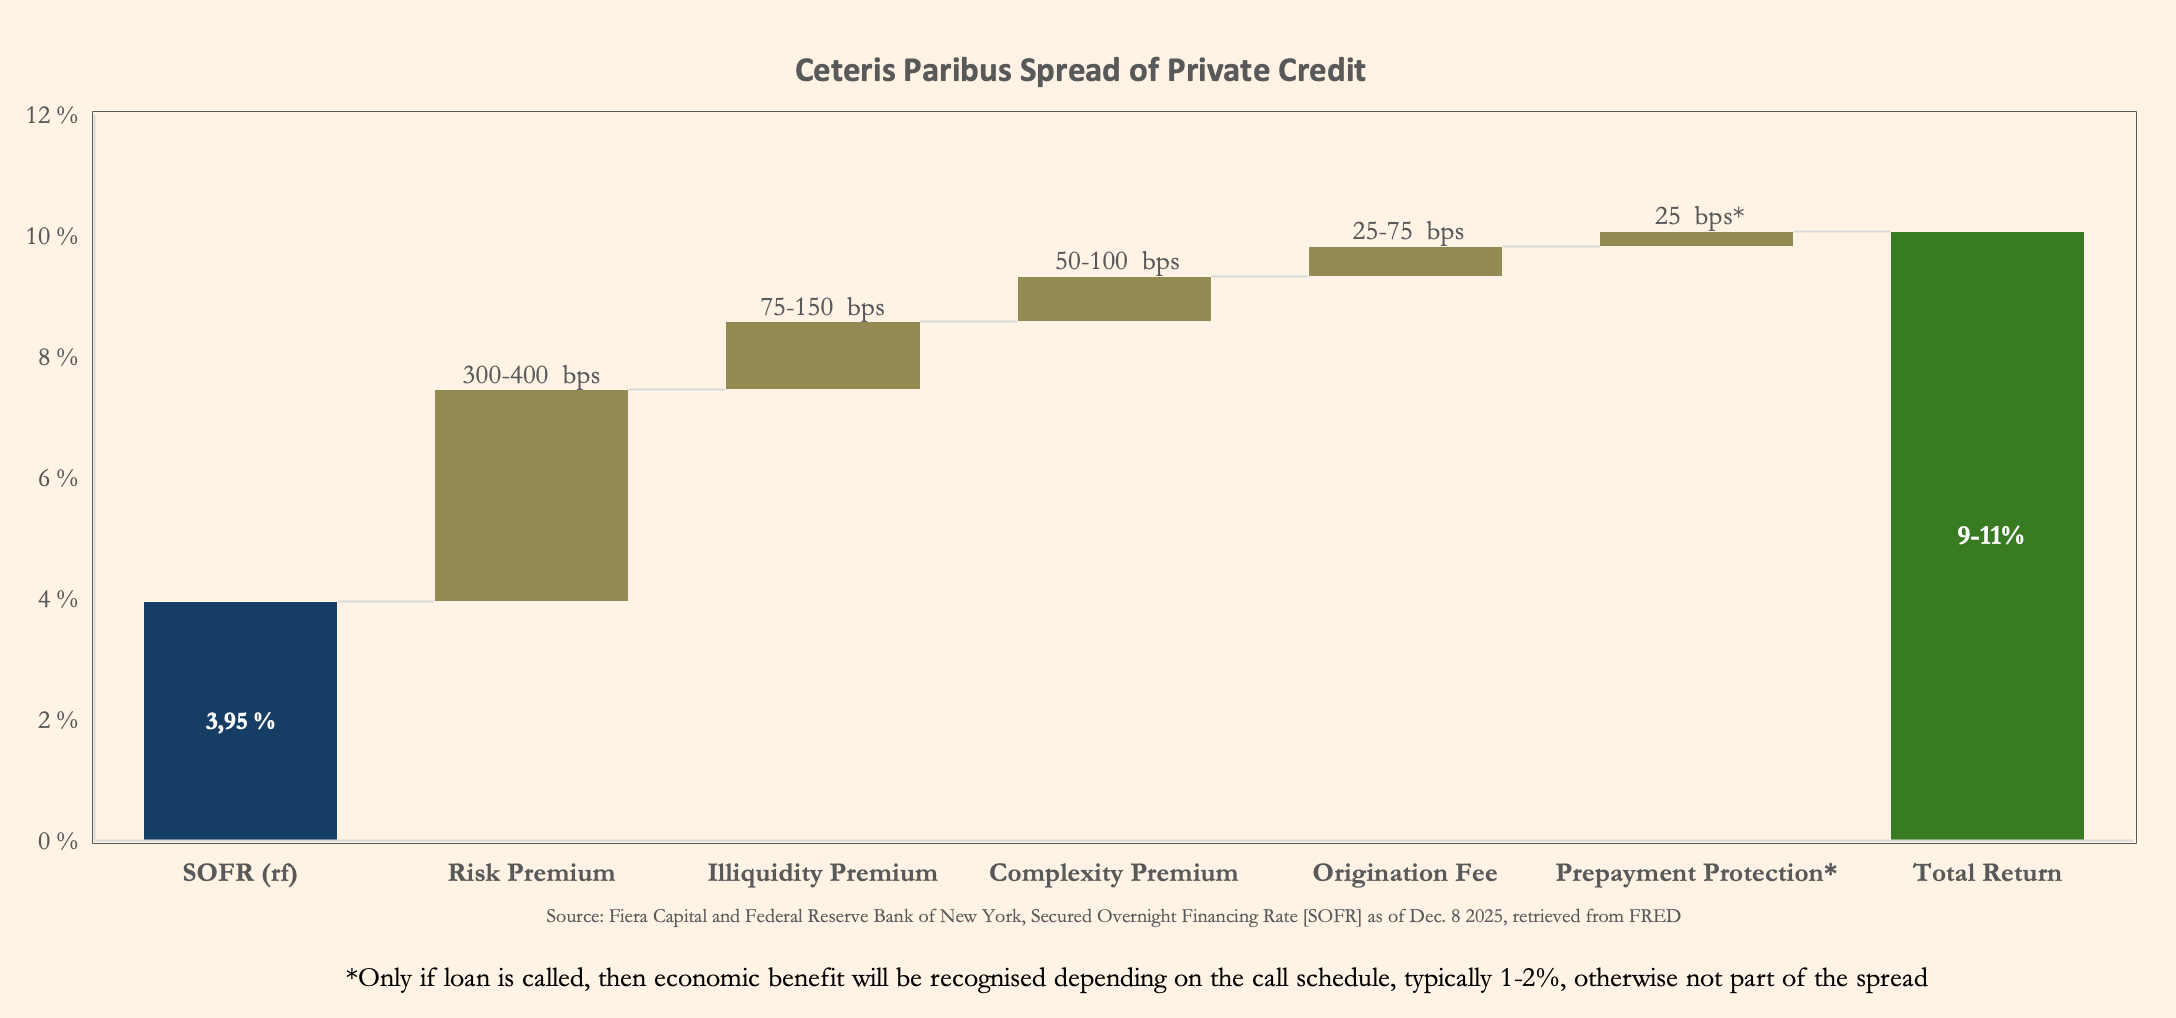
Spread consists of five components, one of which, risk premium, doesn’t require an explanation:
Illiquidity premium – stems from a lack of secondary market since assets are not publicly-traded on exchanges or actively traded over the counter (OTC). Contingent on circumstances, divesting or monetising an investment before maturity is possible but accompanied by high transactional costs, that said, which however doesn’t negate illiquidity, since otherwise it is as good as saying illiquid real estate assets are as liquid as ETFs. Subsequently, holding illiquid assets on long investment horizons with lockup periods forgoing the opportunity to realise the asset intrahorizon should be compensated.
Complexity premium – complexity is in superposition, on one had when observed, due to the nature of the assets being predominantly level 3, i.e. hardest to value, requiring estimation by using amalgamation of different market prices in the absence of quoted prices (making price conveyance quasi-informational since there is irregular temporal gaps between deals), furthermore modelling and assumptions to derive at fair value and yield analysis presupposes significant management judgement. On the other hand, due to the nature of tailored financing solutions themselves, having bespoke terms and debt structures leading to idiosyncratic structural complexity. This duality in turn limits the buyer base to willing buyers with necessary expertise and financial capabilities to evaluate underlying assets and raises the uncertainty in transactions constituting in opportunity costs, which subsequently should be compensated.
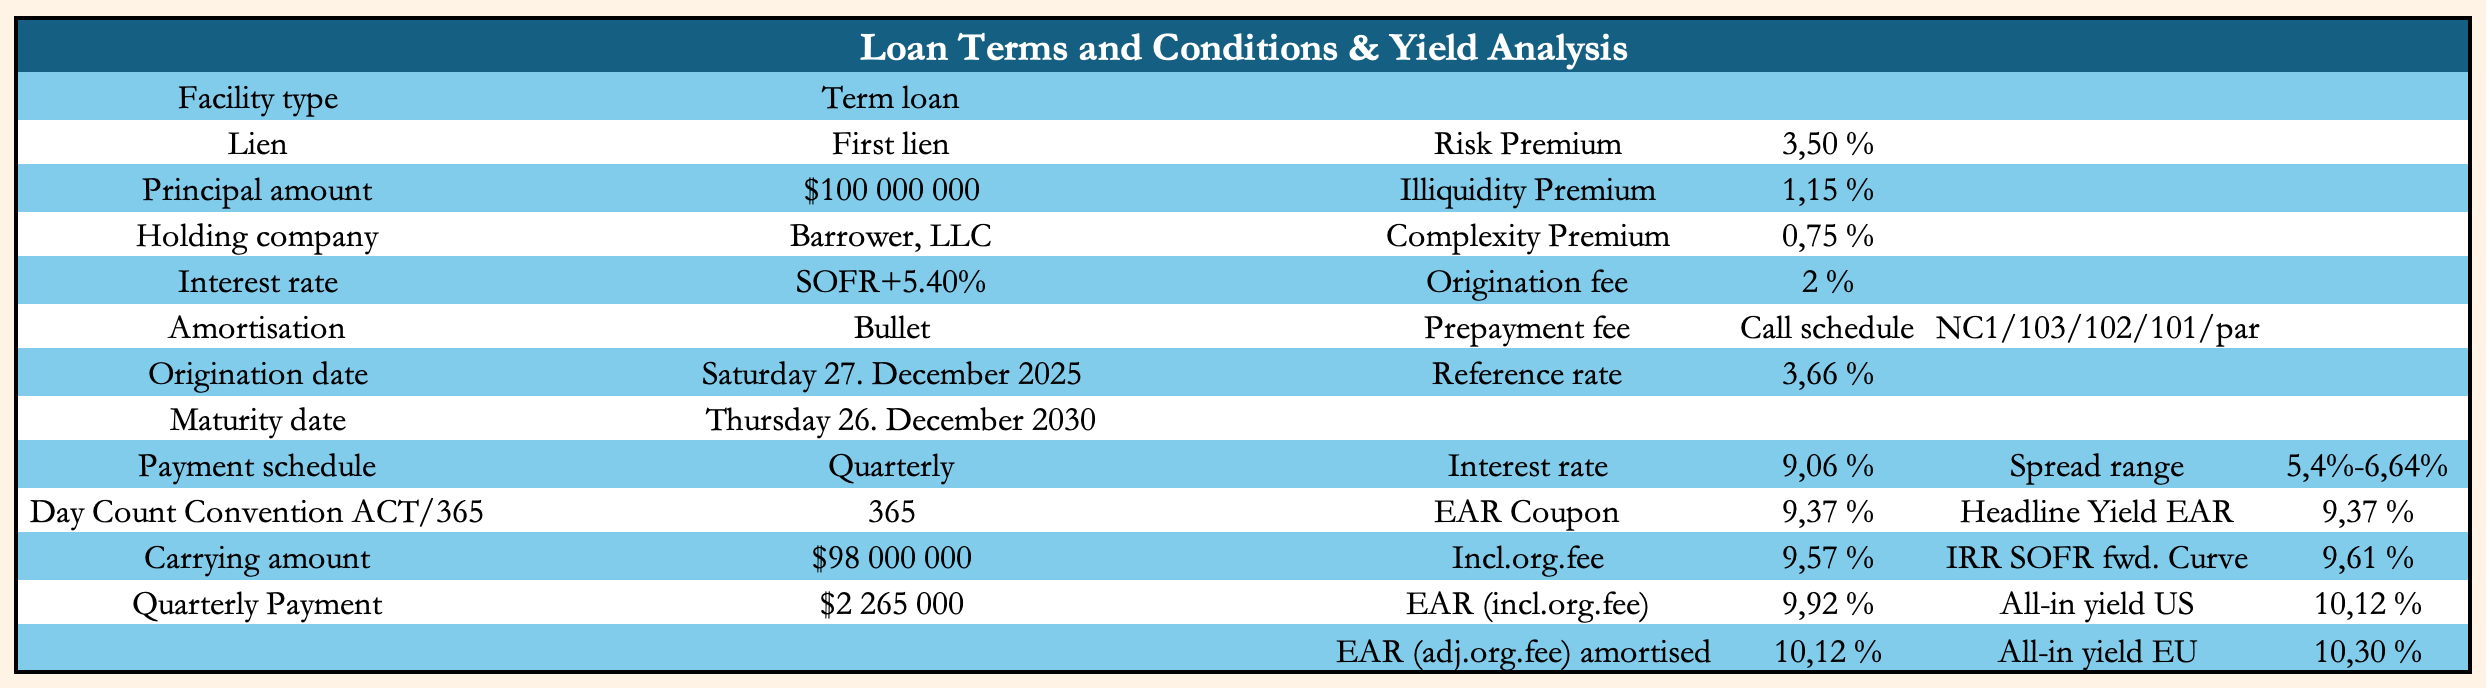
Origination fee – is a percentage of the par value of the principal, essentially a component similar to OID as upfront fees go, that would be amortised typically over 3-4 years, which will constitute a margin accretion. We show in the table below how, utilising effective interest method, origination fee enhances spread from lower carrying value and how different calculation methodologies affect yield. In yield analysis and cash flow projections there would be amortised cost of debt investment adjusted by origination fee and any other yield effecting upfront fees to the effect of all-in yield. Example for OID (original issue discount), say you have a $100mn loan facility at par, but you issue only $98mn to the borrower taking 2% in upfront origination fees.
Prepayment protection – prepayment premium, or rather call protection is not a component of a spread, after a long debate we kept it in, however, reasoning behind this being that we cannot rule it out as a immaterial consideration in asset managers’ yield analysis and confirming that repayments do happen and that those repayments had recently a material effect on prominent market participants, as can be illustrated by latest Apollo’s earnings call transcript snippet – ‘We were facing rates headwind, a prepay headwind, and the roll-off of massively profitable business that as a result of business that we put on at COVID’, Marc Rowan.
Prepayment premium will constitute an economic benefit to a lender entity as non-recurring interest income item; to offset a loss of expected interest income and redeployment costs from called loan, this mitigates the potential risk of repayment occurring, and in the event that it does occur, that there would be a compensation. Call protection comes in various types, and can be a combination of types, following an agreed upon call schedule, the main two type categories to know is ‘make whole’ and ‘hard & soft’ call. Call schedule can be thought as ascending designation by year in make-whole provision and descending designation by year in principal-based provision schedule. Hard call protection is designated as, e.g. 102/101/par, meaning that in the event of repayment, in a given period, in addition to the principal, a percentage of principal amount will be paid as a premium of 2% in a year 1, then 1% in a year 2 and finally in year 3 only par, i.e. no premium. Soft and hard call protection differs in that the hard calls can be triggered by any repayment event, voluntary or unvoluntary, meaning, e.g. in the event of an asset sale or barrower’s breach of covenant, upon which an unvoluntary loan repayment can be initiated that will be subject to the call protection, when soft call is associated predominantly only with voluntary refinancings by the borrower even then with a shorter time constraint, otherwise they’re similar. Make-whole would be typically designated as NC1…3, meaning that if a loan is called in a period designated then present value of the future interest accrual up to the end of that period would be paid in addition to the principal, e.g. if one has NC3 and calls a loan in a year 2, then one pays PV of remaining interest that would’ve accrued till end of year 3.
Floating rate:
As we can see, typically used floating rate has an effect on the returns of PC, risk-free rate component is interbank lending rate depended on the geography of the originator and debtor, broadly Euribor for EEA, Sonia for UK and SOFR for US. These rates are referred to as reference rates; PC loan agreements often carry an interest rate floor component to protect investors from base interest rate changes if monetary policy easing takes it below a specified ‘floor’ i.e. it will not go below a certain minimum, e.g. we’ve seen 75bps (.75%) to 100bps (1%) given as typical examples. Due to the highly flexible nature of structured terms in tailor-made financing solutions, we’ve seen de facto floors used as low as 50bps and as high as 200bps. However, low interest environment can affect adversely net interest income of asset managers, even in situations where extended facilities by traditional lenders do not have floor components in their variable interest rates. Conversely, in such an environment of monetary policy, economic activity would pick-up, producing higher volumes of origination, in addition to improving existing debtors’ ability to service their debt or refinance in more favourable conditions, subsequently lowering actual default rates and non-accruals. Going forward, if this monetary policy cycle continues, which we believe it will, then asset managers will turn to fix rate debt solutions.
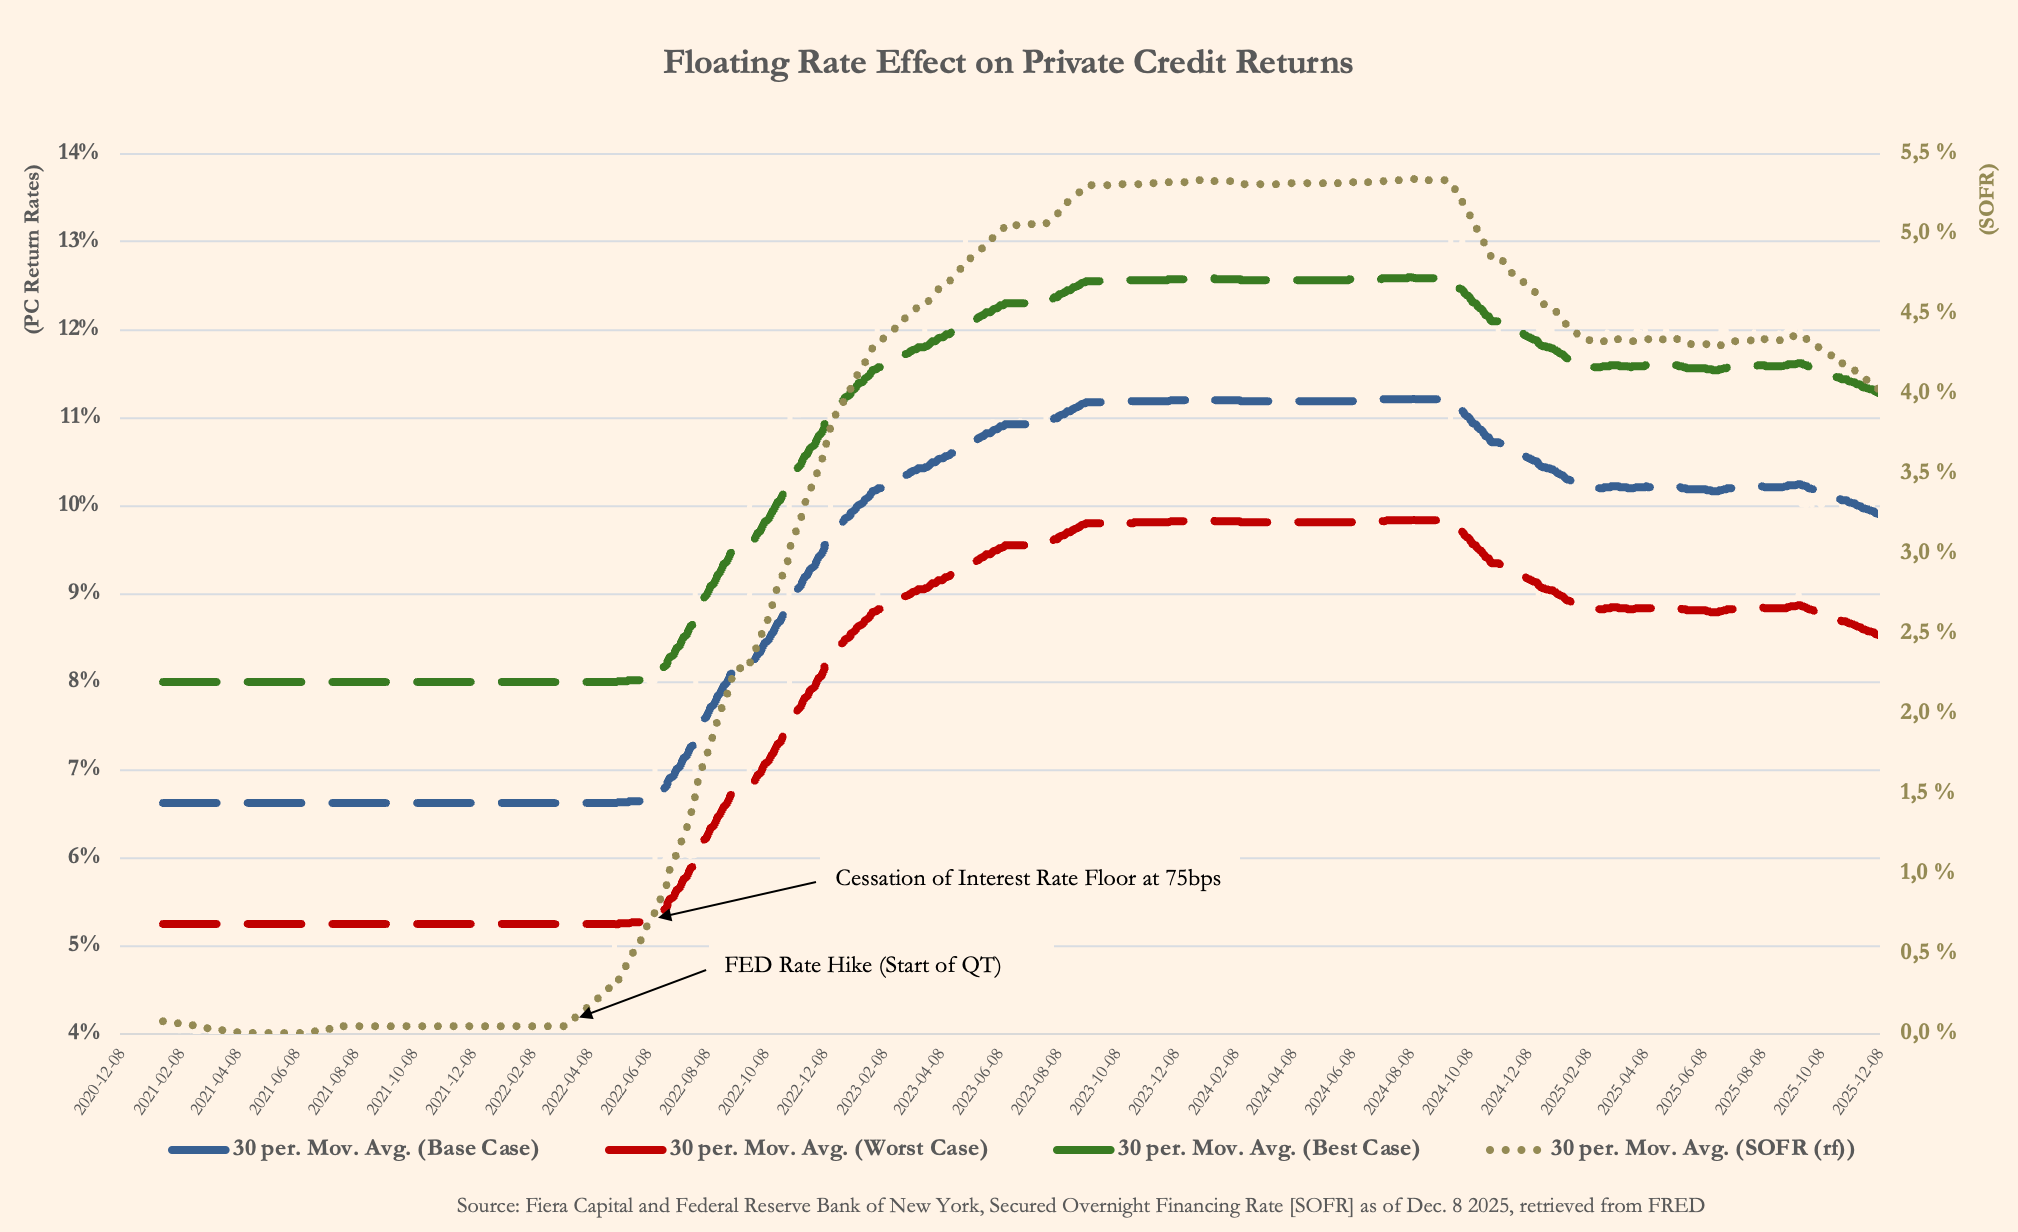
To a degree these worst to best case scenarios represent yield spreads on different quality grades of loans, portfolio skewed towards higher quality debt e.g. having lower weighted average rating factor (WARF), due to higher BB+ component, would be considered more representative of a worst-case scenario. Certain limitations apply, as pure PIK would not be affected by interbank rate and adjustments were made with flat 75bps floor, therefore the line-chart is mostly for illustrative purposes.
The main idea is to provide a visibility on the potential returns using available data and assumptions, base-case and best-case scenarios, even in ‘free money’ era, produced high-single-digit interest income, not taking into consideration potential floors improving the yield. With robust inflows of capital on supply, from eager investors for higher return and yield premiums, in combination with demand for private credit financing from companies – we don’t see PC investment funds unable to service facilities from traditional lenders extended to them, rather it’s depended on barrowing base, default rates and prudence of asset managers.
In Conclusion
For the sake of brevity, we excluded several topics and didn’t venture in depth on others, especially those that were well-covered in other articles and reports we’ve seen, sources were amended upon decision to forgo the use of endnotes due to extensive length, limiting in-text or graph citations to the most essential sources. There is a provision for continuing the discussions as to causes of proliferation of private credit in recent years, and we’ve gathered some material on this, including those opinions contrarian to authors, but inclusion of that section upon revision of this article is on to be determined basis. Nonetheless, we have yet to see such a comprehensive overview of private credit in a single article, tailored to be accessible for readers without prior knowledge in the subject.
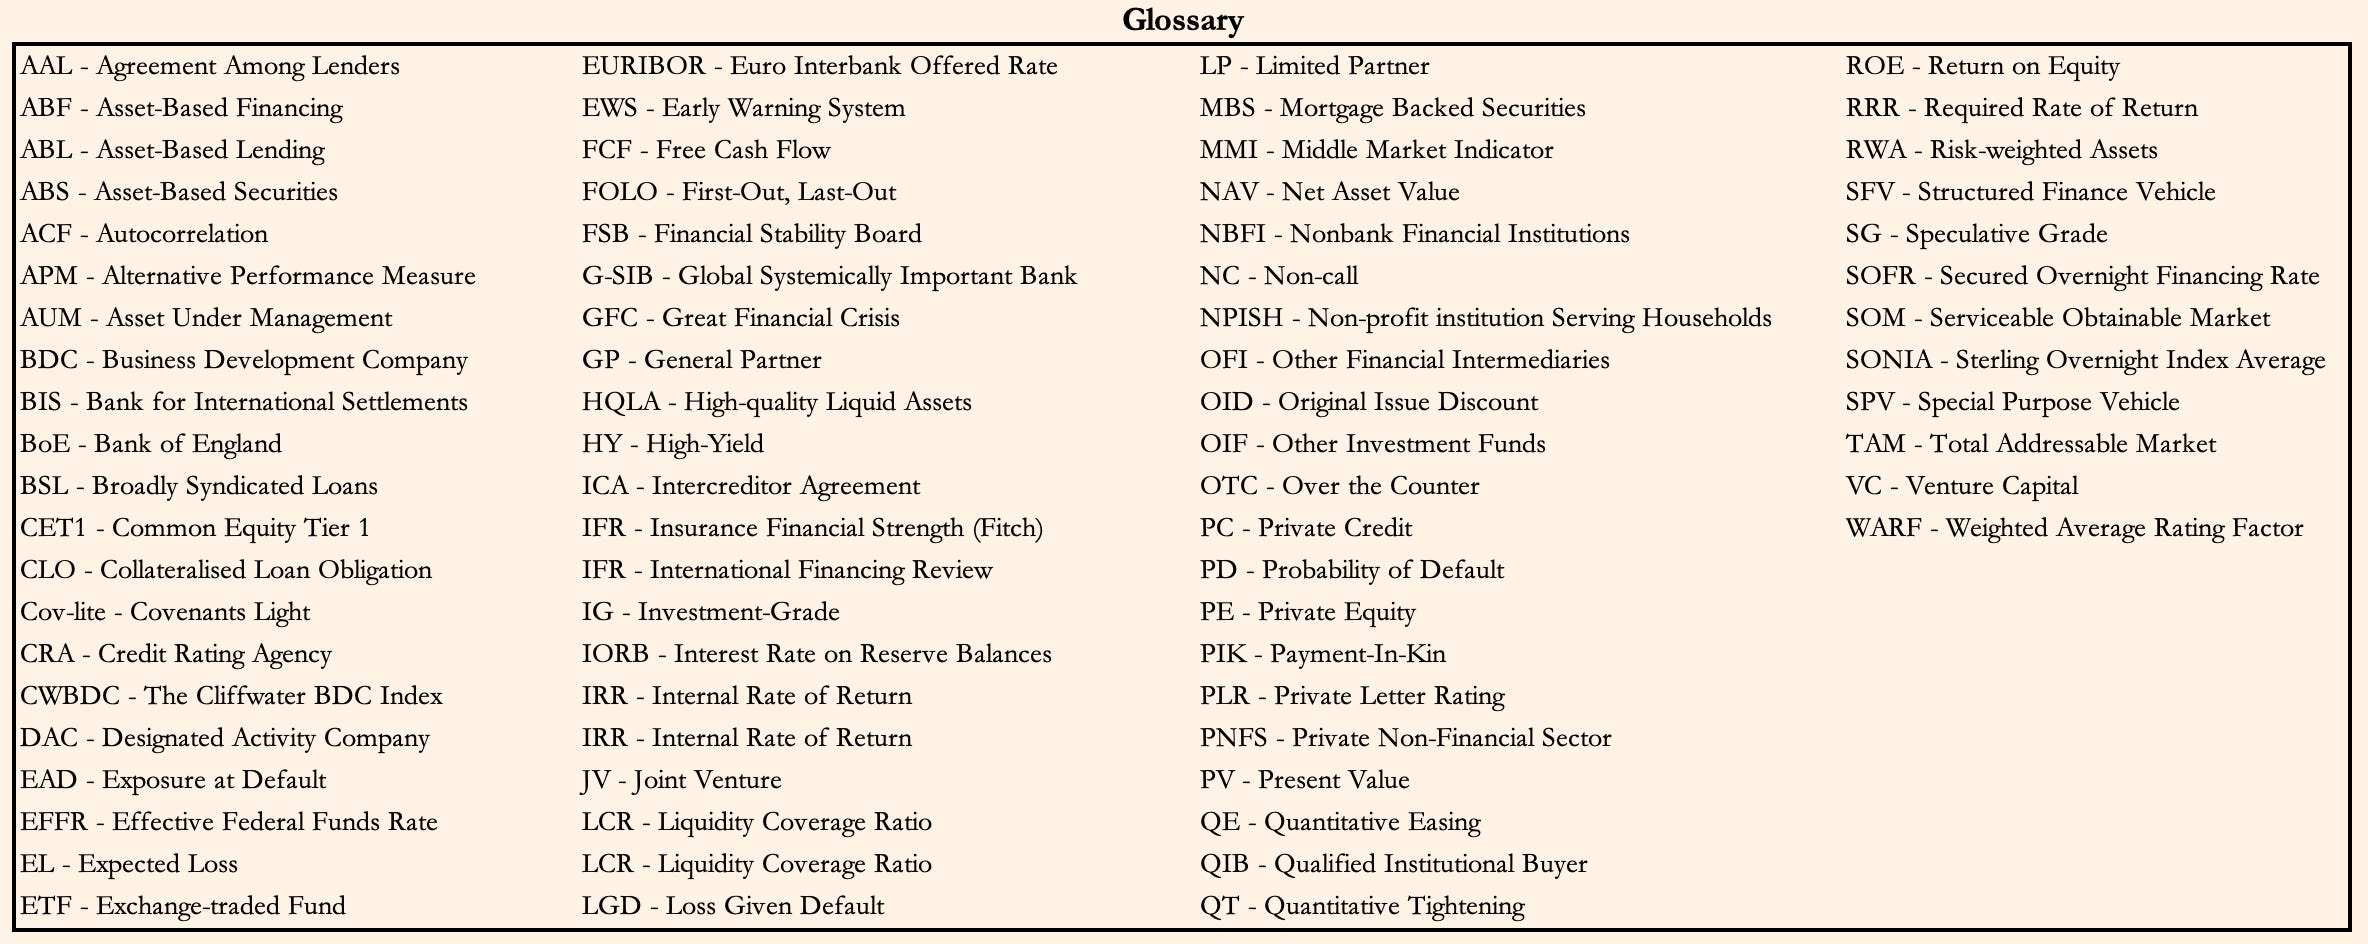
In conclusion-section we’ll have glossary of terms used, since early readers remarked on acronym saturation in the text, and as honourable mentions we’ll provide a barrowers-side views via a survey as to what benefits lenders see in private credit financing, conducted by National Center for the Middle Market.
Middle Market Survey
National Center for the Middle Market sees entities eligibility for the survey and to be middle market constituents as those with lower limit of US$10mn and upper limit of US$1bn in annual revenues.
U.S Middle Market Indicator (MMI) dropped to 10.7% (of annual revenue growth rate) for the first time since 2021 and survey respondents are saying that they’re materially less likely to take on new debt than at the beginning of the year, conversely their willingness during FED balance sheet expansionary period was even lower than it is today, i.e. it might not mean anything as surveys are rarely reliable. Nonetheless these surveys are conducted by leading authority (NCMM) on the health of U.S middle market, with backing by Visa, so let’s hear barrowing-side’s opinion on the private credit.
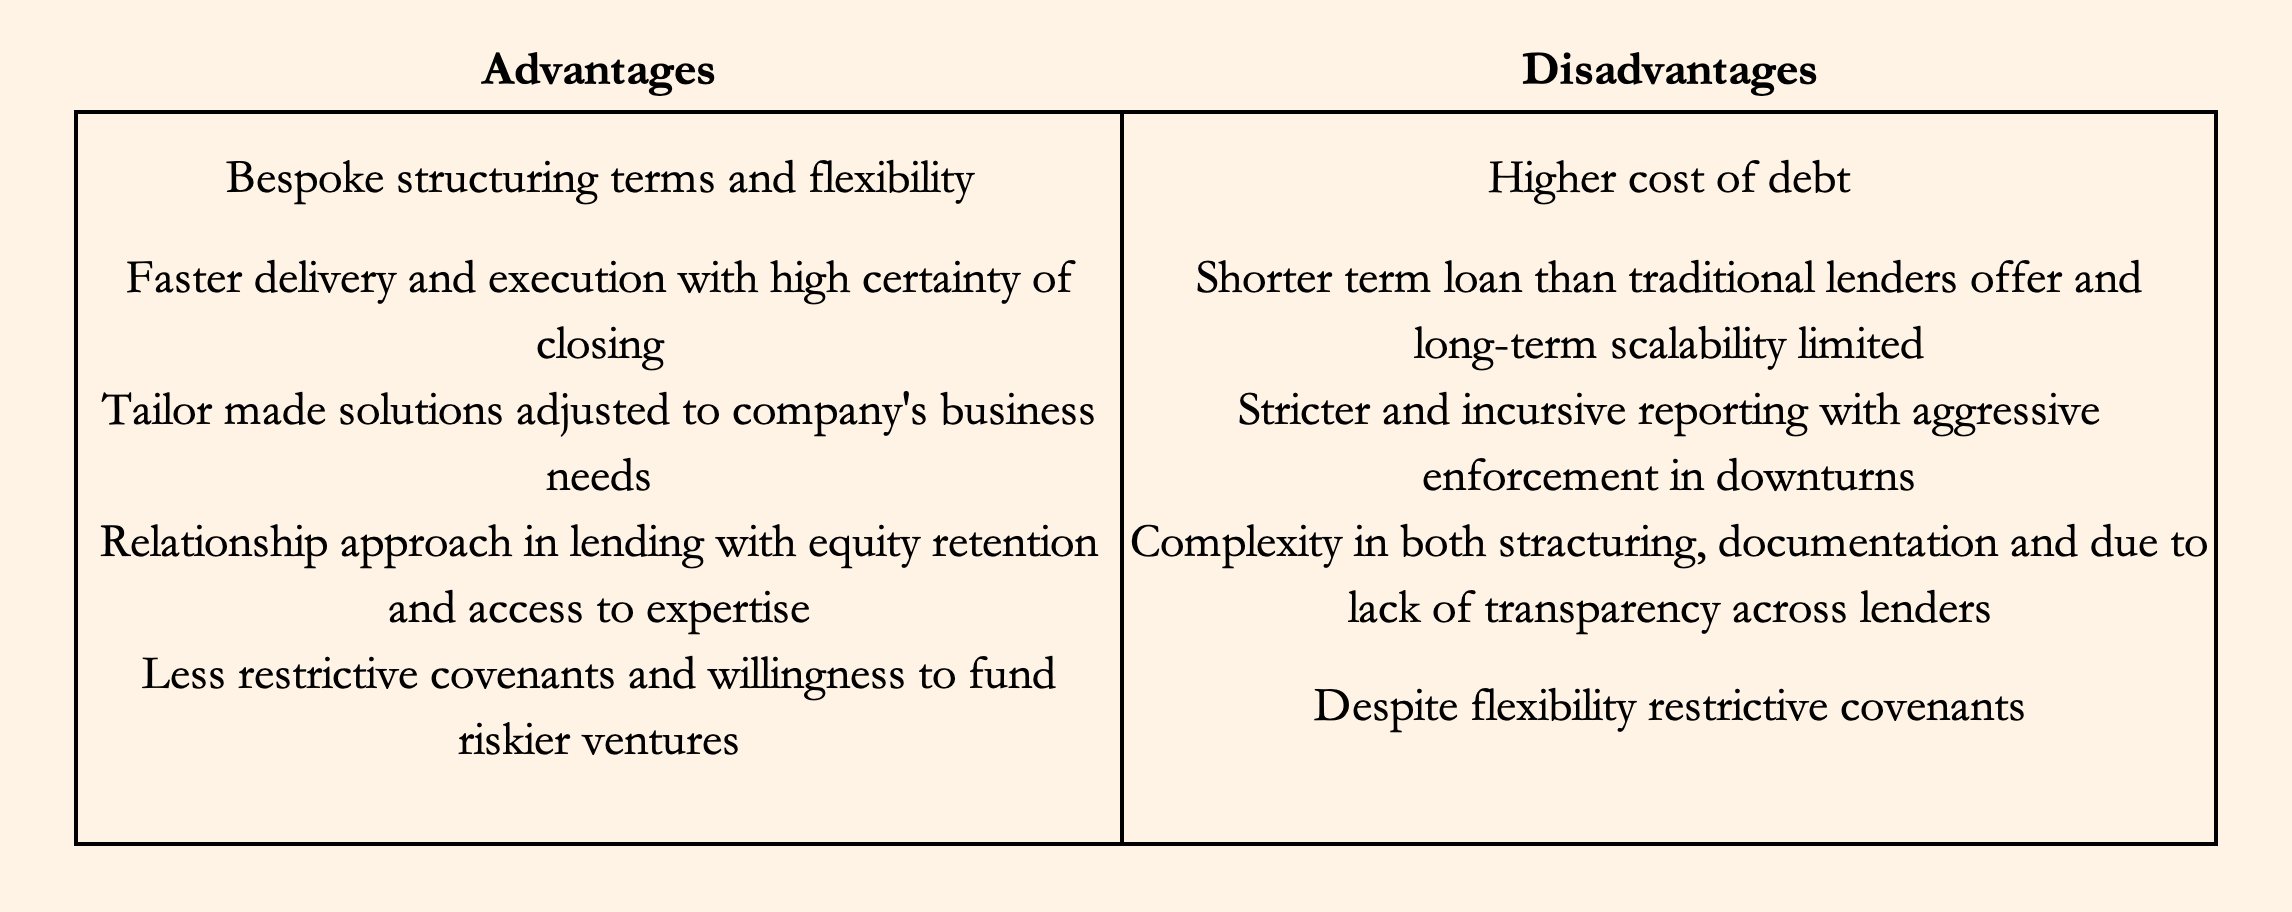
Respondents to the survey were not discriminating between funding sources, using several options from traditional lenders to sponsor-backed financing. Predominantly utilising the following PC financing options: ABL, revenue-based lending and senior secured loans. Interestingly three-quarters of respondents with PE ownership used one or several private credit solutions. They name following pros and cons:
– The Cliffwater BDC Index (CWBDC) –
If of interest, here is an industry-standard index,
please use a following link to access: CWBDC
Disclaimer: This is an opinion. Information provided is not investment or financial advice and we will not be held liable for any losses arising from your use of information. All statistics and data have been gathered from reliable sources; however, the interpretation, analysis, and assumptions derived from this data are solely our own and represent our opinions.
Great Read!
The post notes that 60% of bank exposure to NBFIs is concentrated in just five G-SIBs. If we see a significant drawdown in revolving credit facilities during a liquidity crunch, do you believe the “shadow banking” nature of private credit provides a genuine buffer for the systemic financial system, or does the interconnectedness with G-SIBs create a circular risk loop that regulators are currently underestimating?